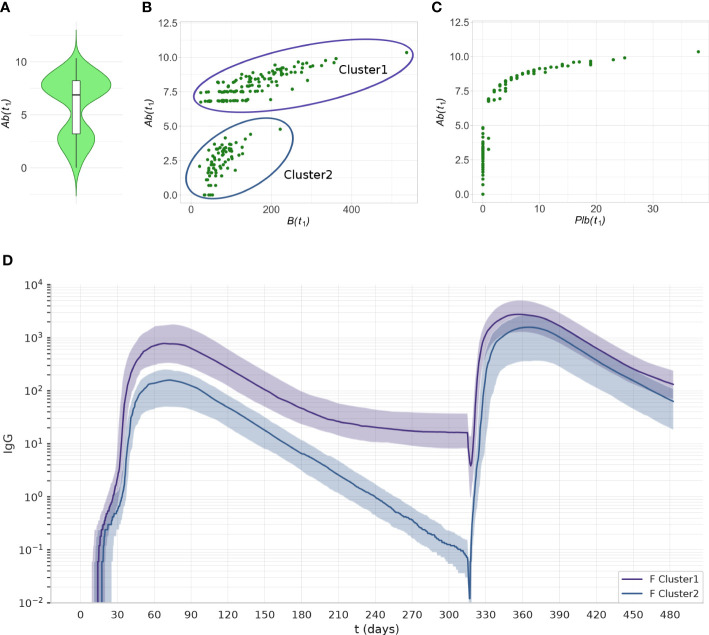
Figure 9.
The two clusters identified by PCA can be separated by their level of Ab(t 1) Data from experiment 1C are reported. (A) The violin plot of Ab(t 1) reveals two clusters with different levels of Ab. (B) The scatterplot shows that the individuals with low antibody levels have, in most cases, no plasma cells. (C) the scatterplot shows that the individuals with low levels of antibody have memory B cells. (D) The antibody dynamics of the two clusters is different, cluster 1 represents antibody sustainers, and cluster 2 represents antibody decayers. The plots represent the median (lines) and IQR (shaded area) of variable Ab in cluster 1 and cluster 2.

