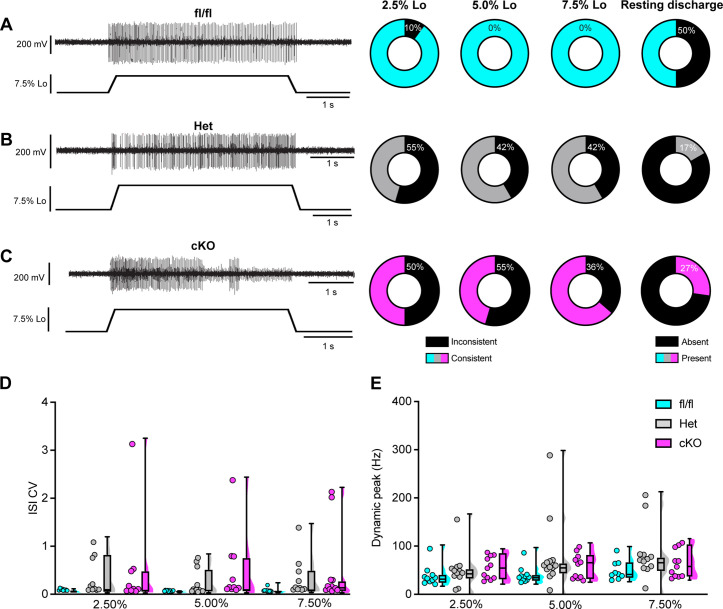
Figure 8. Loss of NaV1.1 reduces static muscle stretch sensitivity and reliability.
(A–C) Representative responses to ramp-and-hold muscle stretch at 7.5% of optimal length (Lo) from Scn1a-floxed (A), Scn1a-Het (B), and Scn1a-cKO (C) afferents. Afferents from Scn1a-Het and Scn1a-cKO mice were more likely to show inconsistent firing during the hold phase of stretch. The percentage of afferents from each genotype that were able to fire consistently for the entire duration of stretch at 2.5, 5.0, and 7.5% of Lo is shown in the pie charts next to the representative trace from their genotype (black indicates percentage with inconsistent firing). The final pie charts represent the proportion of afferents that exhibited resting discharge at Lo for every stretch for each genotype (black indicates absence of resting discharge). (D) Inconsistency in firing was quantified as the interspike interval coefficient of variation (ISI CV) during the plateau stage of the hold phase of stretch (1.5–3.5 s into stretch) for the three different genotypes. A significant effect of genotype was observed (two-way mixed-design ANOVA, p=0.015). (E) The highest firing rate during the rampup phase of stretch (dynamic peak) is a measure of dynamic sensitivity. No significant effect of genotype on dynamic peak was observed (two-way mixed-design ANOVA, p=0.0633). Box and whisker plots represent maximum, minimum, median, upper and lower quartiles of data sets Each dot represents one afferent in (D) and (E) (Scn1a-floxed, n = 10; Scn1a-Het, n = 12; Scn1a-cKO, n = 11).

