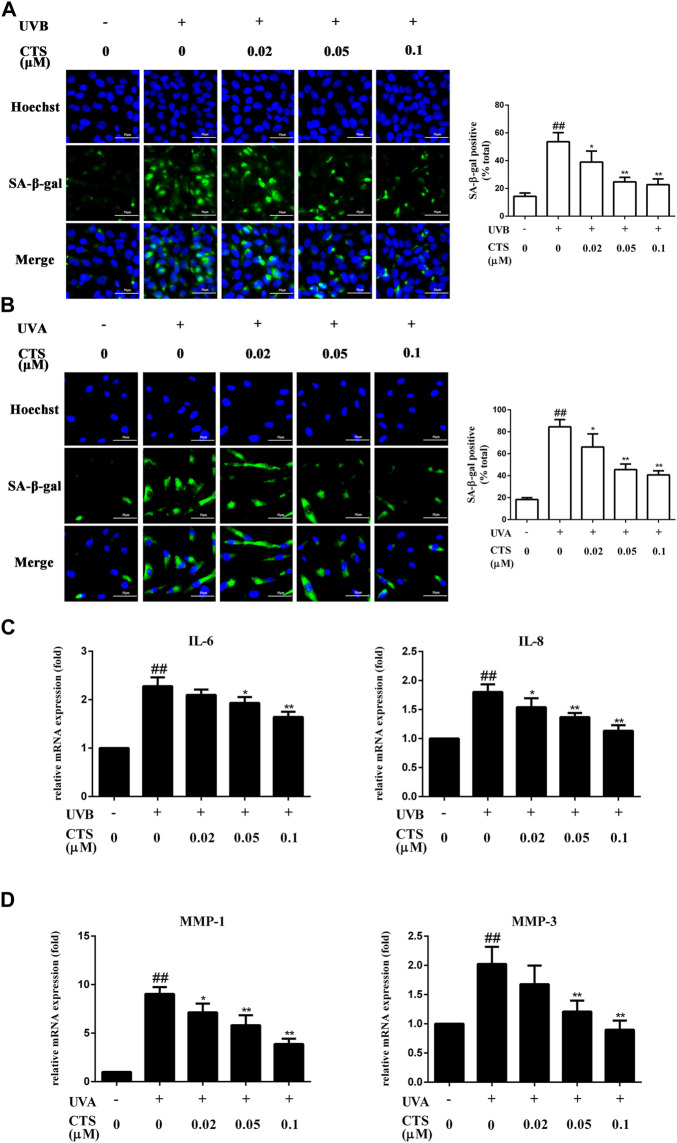
FIGURE 1.
Effects of CTS on UV radiation-induced senescence in HaCaT cells and HFF-1 cells. HaCaT cells and HFF-1 cells were treated with CTS (0, 0.02, 0.05, 0.1 μM) for 12 h and then irradiated with UVB (200 mJ/cm2) and UVA (15 J/cm2), respectively. After that, the cells were cultured with fresh medium supplemented with the corresponding concentrations of CTS (0, 0.02, 0.05, and 0.1 μM) for another 12 h in the case of HaCaT cells before analysis, and 24 h for HFF-1 cells. (A) SA-β-gal-positive HaCaT cells as measured by fluorescence staining after 12-h of incubation following UVB irradiation. The plot besides the fluorescence image shows the number of senescent HaCaT cells. Scale bars: 50 μm. (B) SA-β-gal-positive HFF-1 cells as measured by fluorescence staining after 24-h of incubation following UVA irradiation. The plot besides the fluorescence image counts the number of senescent HFF-1 cells. Scale bars: 50 μm. (C) qPCR analysis of IL-6 and IL-8 mRNA levels in HaCaT cells after 12-h of incubation following UVB irradiation. (D) qPCR analysis of MMP-1 and MMP-3 mRNA levels in HFF-1 cells after 24-h of incubation following UVA irradiation. All data are mean ± SD from three independent experiments, “##” indicates significantly different from the control (no irradiation and CTS treatment) at the p < 0.01 level, whereas “*” and “**” indicate significantly different from the UV-irradiated cells without CTS pretreatment at the p < 0.05 and p < 0.01 levels, respectively.

