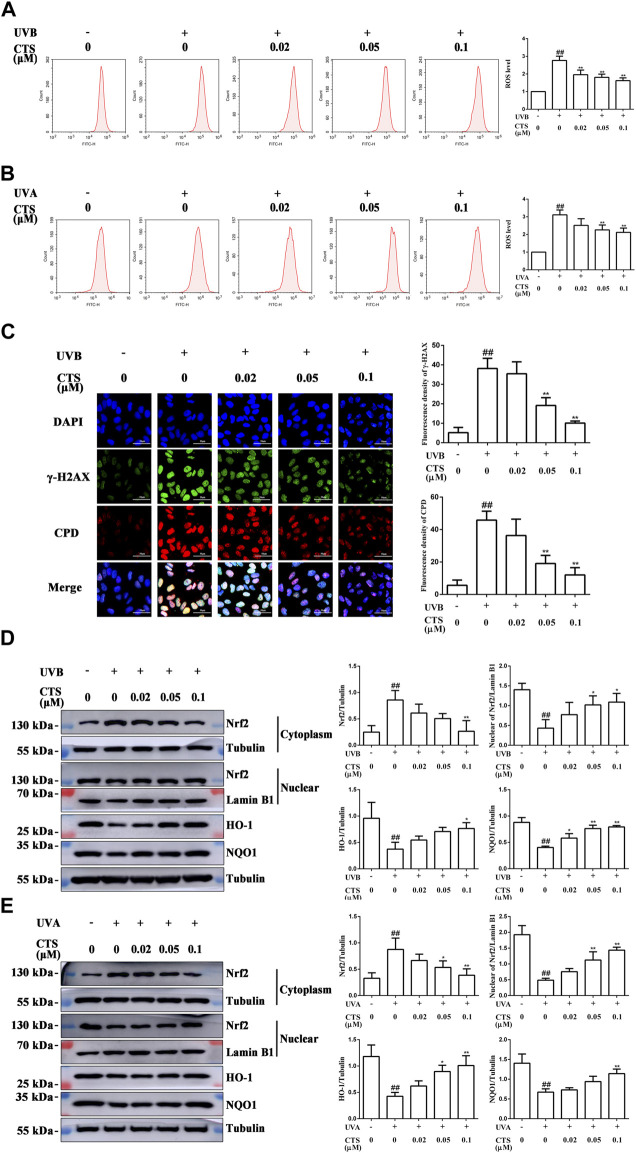
FIGURE 2.
Effects of CTS on UV radiation-inflicted oxidative damage in HaCaT cells and HFF-1 cells. HaCaT cells and HFF-1 cells were treated with CTS (0, 0.02, 0.05, 0.1 μM) for 4 h prior to UVB (200 mJ/cm2) and UVA (15 J/cm2) irradiation, respectively. After UV irradiation, the cells were supplemented with the corresponding doses of CTS and incubated for different times before analysis. (A) Flow cytometry analysis of ROS production by HaCaT cells. The plot quantitatively compares the levels of ROS for the different CTS concentrations. (B) Flow cytometry analysis of ROS production by HFF-1 cells. The plot quantitatively compares the levels of ROS for the different CTS concentrations. (C) Immunofluorescence staining of CPD and γ-H2AX proteins in HaCaT cells after 2-h of incubation following UVB irradiation. Red fluorescence represents CPD, whereas green fluorescence represents γ-H2AX. All cells were counterstained with DAPI (blue). Scale bars: 50 μm. The plot besides the fluorescence image counts the number of CPD. Positive cells and γ-H2AX positive cells. (D) Western blot analysis of Nrf2, HO-1, NQO1 protein levels in the cytoplasm of HaCaT cells, and Nrf2 protein level in the nucleus after 0.5-h of incubation following UVB irradiation. The plots show the quantitative analysis of protein expression. (E) Western blot analysis of Nrf2, HO-1, NQO1 protein levels in the cytoplasm of HFF-1 cells, and Nrf2 protein level in the nucleus after 0.5-h of incubation following UVA irradiation. The plots show the quantitative analysis of protein expression. All data are mean ± SD from three independent experiments, “##” indicates significantly different from the control (no irradiation and CTS treatment) at the p < 0.01 level, whereas “*” and “**” indicate significantly different from the UV-irradiated cells without CTS pretreatment at the p < 0.05 and p < 0.01 levels, respectively.

