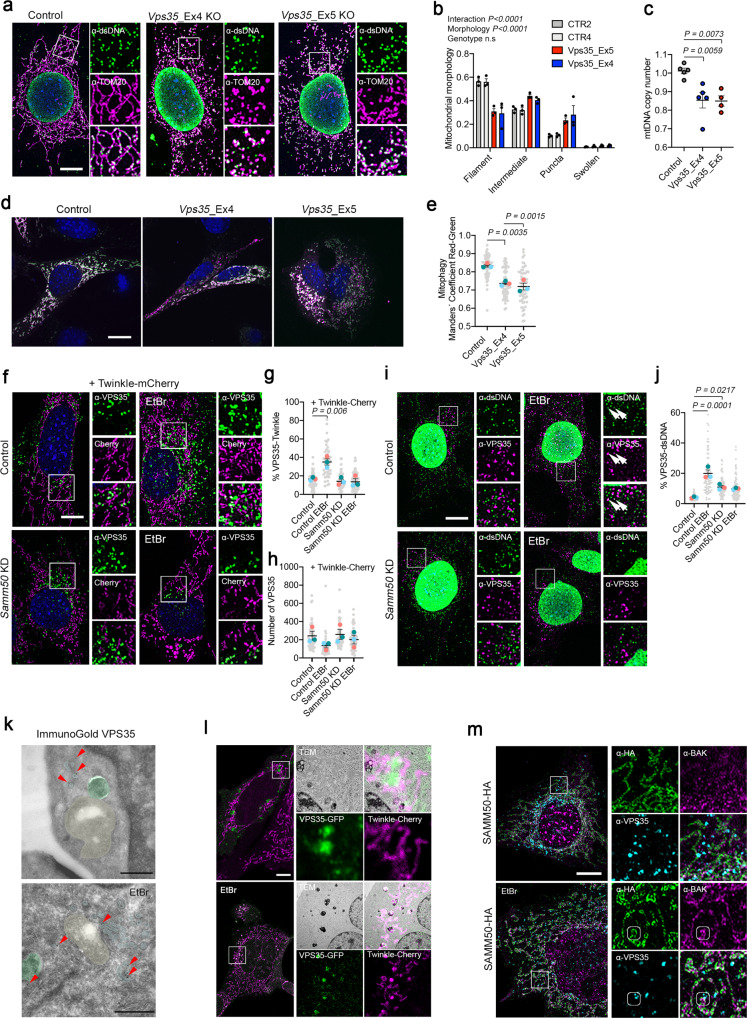
Fig. 7. SAMM50 and VPS35 are required for nucleoid and specific mtDNA elimination.
a α-TOM20 and α-dsDNA immunofluorescence of Vps35 KO MEFs and b Mitochondrial morphology quantification (n = 3, >30 cells per replicate). c mtDNA copy number of Vps35 KO cells (n = 5 independent cultures). d Control and Vps35 KO cells transfected with Fis1p-GFP-mCherry plasmid to detect canonical mitophagy. Red signal represents mito-lysosomes. e Manders’ coefficient quantification of transfected cells. A decrease in Manders’ coefficient indicates canonical mitophagy activation (n = 3, >20 cells per replicate). f α-VPS35 labeling in control and Samm50 KD cells transduced with Twinkle-mCherry and treated with EtBr. g Quantification of VPS35 contact site with Twinkle and h number of VPS35 foci per cell (n = 3, >15 cells per replicate). i α-VPS35 and α-dsDNA immunofluorescence in control and Samm50 KD cells. j Quantification of dsDNA foci in contact with VPS35 endosomes (n = 3, >20 cells per replicate). k Immunogold labeling of VPS35 in steady state and EtBr treated cells. Gold particles are signalized by red arrows. Mitochondria were colored in yellow, endosomes in cyan and late autophagy organelles in green. l Correlative Light-Electron microscopy in cells expressing Twinkle-Cherry and transiently transfected with VPS35-GFP, in steady state and after EtBr treatment. (n = 5 transfected cells). m Representative images of Airy Scan Super-Resolution microscopy of cells transduced with SAMM50-HA and labeled with α-HA, α-VPS35 and α-BAK, in steady state and upon EtBr treatment. Small frames mark colocalization of three proteins (marked in three channels). Scale bar, 10 µm (a, d, f, i, l, and m) and 500 nm (k). P values calculated using One-way ANOVA with Tukey correction for multiple comparison (c, e, g, h, and j) and Two-way ANOVA for Genotype and Morphology interaction (n.s = no significative). Data is presented as mean ± SEM.

