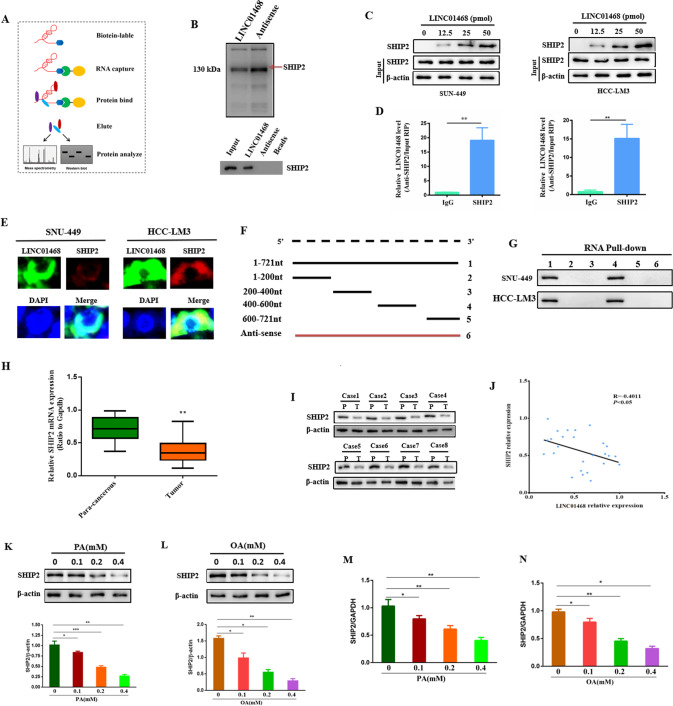
Fig. 4. LINC01468 directly binds with SHIP2.
A RNA pull-down assay flowchart was used to identify LINC01468-associated proteins. B The biotinylated LINC01468-associated proteins were stained with silver, and the bands specifically precipitated by LINC01468 were excised and submitted for mass spectrometry (top) and western blot (bottom) analysis. The arrows indicate SHIP2 proteins as the unique bands for LINC01468. C The interaction of SHIP2 and LINC01468 was analyzed by western blot. D RIP assay was performed to detect LINC01468 enrichment in the immunoprecipitated complexes using anti-SHIP2 antibodies. E FISH and IF assays were performed to determine the co-localization of LINC01468 (Cy3; red) and SHIP2 (green) in cells. Nuclei, blue (DAPI). F Diagrams of full-length LINC01468 and its deletion fragments of the SHIP2-binding domain in LINC01468. G SHIP2 pulled down by different LINC01468 constructs was tested by western blot. H The expression analysis of SHIP2 from 26 pairs of HCC tissues and corresponding para-cancerous tissues from human NAFLD-HCC by qRT-PCR. I Western blot analysis of SHIP2 in human NAFLD-associated HCC. Representative western blot images and expression levels of tumors (T) and adjacent nontumors (NT) from eight paired NAFLD-associated HCCs. J Pearson correlation analysis of LINC01468 and SHIP2 expression in 26 HCC tissues. K, L SHIP2 protein expression in palmitic acid- (K) or oleic acid-treated (L) SNU-182 cells (n = 3 per group). **P < 0.01. M, N LINC01468 expression in (M) palmitic acid- or (N) oleic acid-treated SNU-182 cells by qRT-PCR (n = 3 per group). The data represent the mean ± S.D (*P < 0.05; **P < 0.01; ***P < 0.005).

