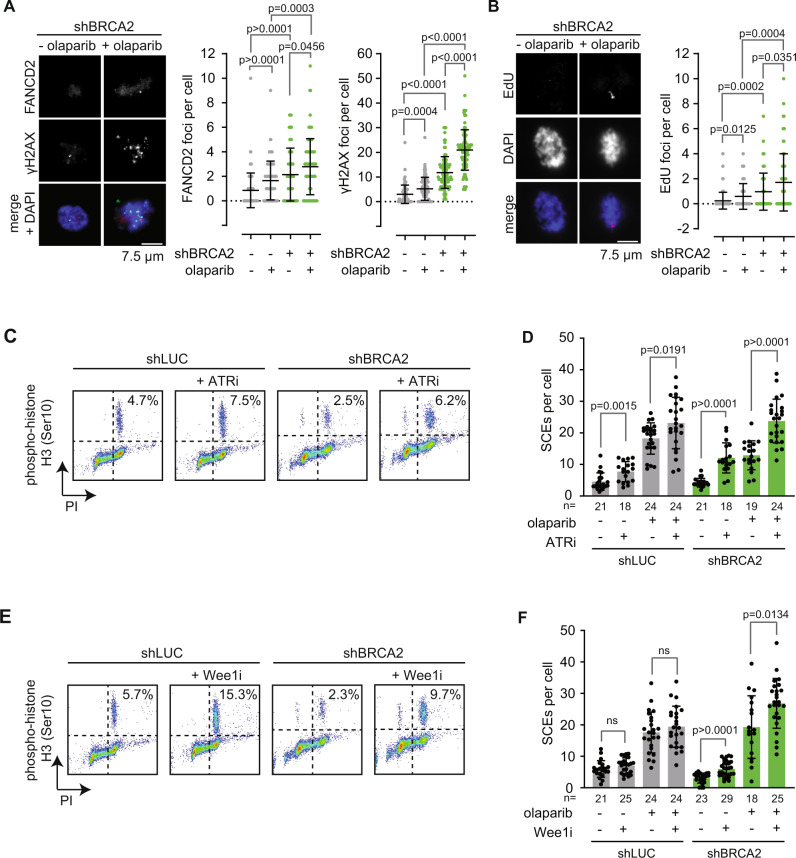
Fig. 4. SCEs originate from mitotic processing of under-replicated DNA.
A RPE1 TP53-/- shBRCA2 were pre-treated with doxycycline (dox), synchronized using RO-3306 for 4 h, and subsequently treated with olaparib where indicated. γH2AX and FANCD2 foci in mitotic cells were quantified by immunofluorescence microscopy. Means and standard deviation of pooled data from three independent experiments are shown, with n = 30 mitoses per experiment. B RPE1 TP53-/- shBRCA2 were treated as for panel A. 24 h after olaparib treatment, cells were incubated for 25 min with EdU. Mitotic EdU foci were quantified in n = 30 mitoses per experiment. Means and standard deviation of pooled data from three independent experiments are shown. C, D RPE1 TP53-/- shBRCA2 cells were treated with doxycycline (dox) for 48 h, with olaparib for 24 h, with or without the ATR inhibitor VE-821 (ATRi) for 3 h. Cells were treated with colcemid for 3 h before harvesting, fixed and stained for the mitotic marker phospho-Histone-H3 (C). In parallel, SCEs were quantified by microscopy analysis of at least 18 metaphase spreads per condition. Exact n values are indicated in the figure (D). Exact n values are provided in the figure. E, F RPE1 TP53-/- shBRCA2 cells were treated with doxycycline (dox) for 48 h, with olaparib for 24 h, with or without the Wee1 inhibitor AZD-1775 (Wee1i) for 3 h. Cells were treated with colcemid for 3 h before harvesting, fixed and stained for the mitotic marker phospho-Histone-H3 (E). In parallel, SCEs were quantified by microscopy analysis of at least 18 metaphase spreads per condition. Exact n values are indicated in the figure (F). Statistics in panels A, B, D, and F were performed using two-sided Mann-Whitney tests (ns: non-significant). Gray bars indicate HR-proficient conditions, green bars indicate HR-defective conditions. Source data are provided with this paper.

