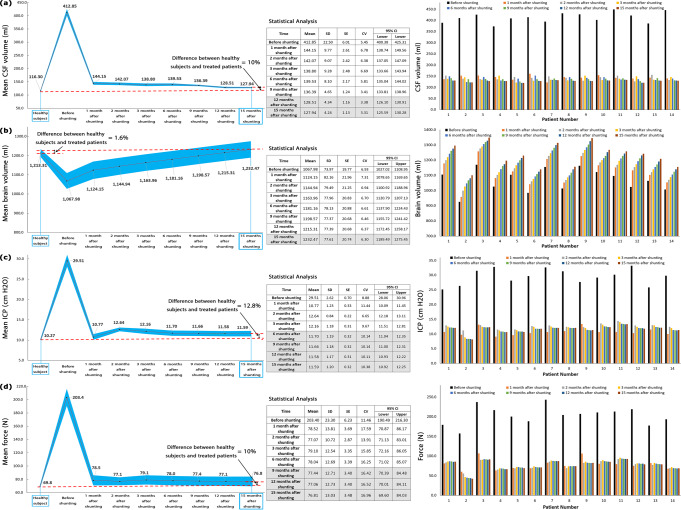
Fig. 2. Changes in volumes of CSF and brain, ICP, and force after shunting.
a Mean CSF volume and CSF volumes of all patients before shunting until 15 months after shunting. b Mean brain volume and brain volumes of all patients before shunting until 15 months after shunting. c Mean ICP and ICPs of all patients before shunting until 15 months after shunting. d Mean force and forces in all patients before shunting until 15 months after shunting. It should be noted that the mean volumes, ICP, and force for healthy subjects also showed on the left side panels. The gray areas in statistical analysis tables show the stable areas of volumes, ICP, and fore changes. The CSF volume, brain volume, ICP, and forces values reached stable conditions 12, 15, 6, and 9 months after shunting, respectively. Since the differences between the values of these parameters in stable months were less than 1.0%. Hence, follow-up was stopped 15 months after shunting, and results were reported until the fifteenth month. Raw data for Fig. 2 is included in Supplementary Data 1. CSF cerebrospinal fluid, ICP intracranial pressure, SD standard deviation, SE standard error, CV coefficient of variation, CI confidence of interval.

