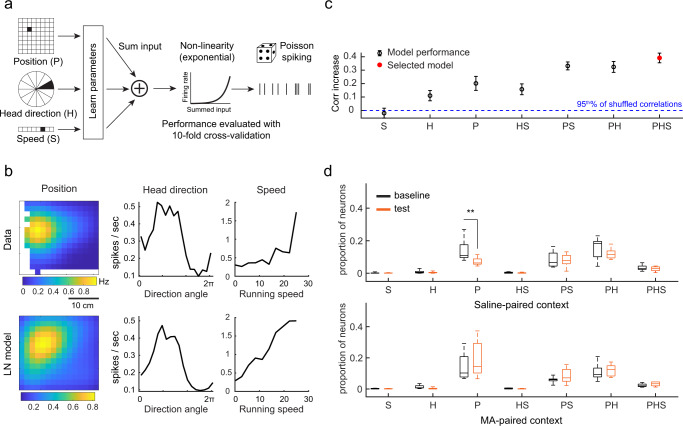
Fig. 6. Drug-context associations primarily affect place cells that are exclusively tuned to allocentric position.
a Schematic of linear-non-linear Poisson (LN) model framework. P represents position, H represents head direction, S represents speed. b Calcium event rate tuning curves (top) and model-derived response profiles from an example PHS cell. c Example of model performance across all models for the example neuron in (b) (mean ± SEM, correlation increase relative to the 95th % of the shuffled correlation, n = 10 cross validations). The selected model is indicated in red. d Proportion of total neurons for each cell type in baseline and test sessions of MA mice. There is a significant decrease of P-encoding neurons in test compared to baseline, specifically in the saline-paired context (p = 0.0039, two-tailed sign-rank test, n = 9 mice). For each box plot, the center indicates median, the box indicates 25th and 75th percentiles. The whiskers extend to the most extreme data points without outliers.

