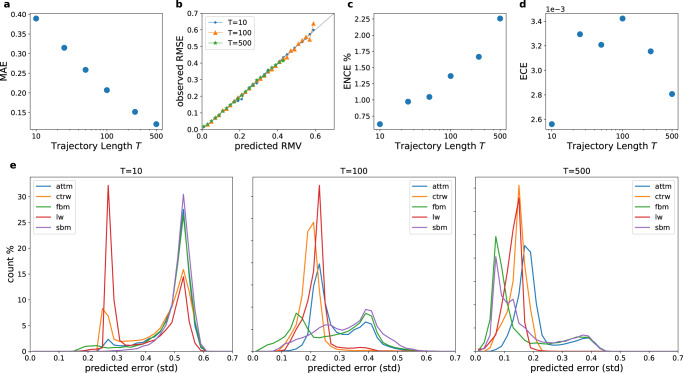
Fig. 3. Performance evaluation for the regression of the anomalous exponent α.
a Mean absolute error (MAE), b reliability diagram and expected (c) normalised and (d) non-normalised calibration error (ENCE/ECE)82 achieved by Multi-SWAG (see Supplementary Information for detailed definitions). Results are plotted for different trajectory lengths T by averaging over 105 test trajectories each. The MAEs (a) show a decreasing trend with trajectory length, with results close to those achieved in the AnDi-Challenge, reaching an MAE of 0.14 for T = 500. To judge the error prediction performance, the reliability diagram (b) depicts the observed root mean squared error (RMSE) as a function of the predicted root mean variance (RMV), showing that even for very short trajectories T = 10 an error prediction close to the ideal (grey line) is achieved. The reliability diagram can be summarised in a single value using the ECE/ENCE. The ENCE/ECE characterises the mean difference between predicted and observed errors, either normalised to obtain a relative error (ENCE) or as an absolute (ECE). As visible in (b), we obtain good error predictions with an ENCE between 0.6 and 2.3% depending on the trajectory length. The increase in ENCE with trajectory lengths can be attributed to the decrease in MAE (and therefore predicted errors), while the unnormalised ECE only shows a slight trend of decreasing with trajectory length. The low ECE for T = 10 is due to the high number of trajectories predicted with near maximal error. e Predicted error histogram for inferring the anomalous diffusion exponent α when the underlying model is unknown. The figure shows the distribution of the error as predicted by Multi-SWAG trained on all models. Each subplot shows the results for a different trajectory length T, as obtained from predictions on 105 trajectories.

