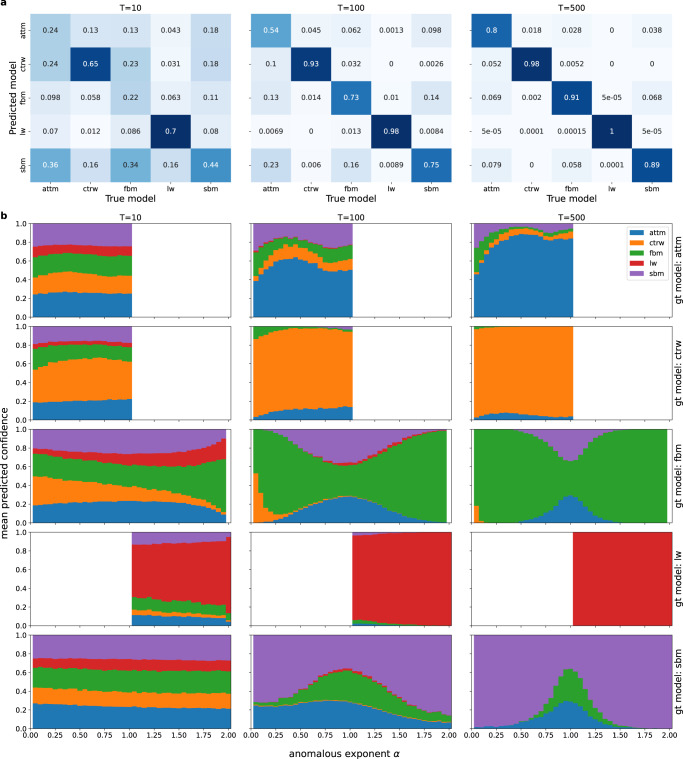
Fig. 8. Analysis of the classification behaviour.
a Confusion matrices for different trajectory lengths. The entries indicate the relative frequency of model predictions (row) given a ground truth model (column). The matrices are obtained from Multi-SWAG predictions on a total of 105 test trajectories for each length. b Mean confidences for different ground truth (gt) models in dependence of the ground truth anomalous diffusion exponent α. From the figure one can infer the confidence for the different models shown as coloured bars as assigned by Multi-SWAG. The illustrations are plotted for different trajectory lengths by averaging over a total of 105 trajectories for each length, translating to 2 × 10⁴ trajectories for each ground truth model and length.

