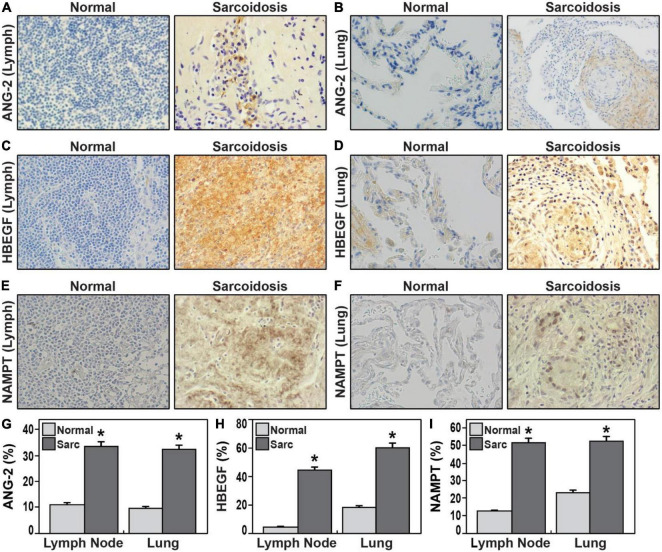
FIGURE 4.
(A–F) Representative immunohistochemical staining of lymph nodes (A,C,E) and lung tissues (B,D,F) from sarcoidosis compared healthy controls 40 × magnification. ANG-2 (A,B,G), HBEGF (C,D,H), NAMPT (E,F,I). (G–I) Bar graphs (G) illustrate quantification of mean proportions of ANG-2, HBEGF, and NAMPT *p < 0.05. Sarcoidosis in dark gray and normal tissue in light gray. ANG-2 expression in lung tissue and lymph node in sarcoidosis was 32.2 and 33.7%, respectively, in contrast to the expression observed in normal lung and lymph nodes was 9.8 and 11.3%, respectively (p = 1.2 e-04). HBEGF expression in sarcoidosis lymph nodes was 44.8% vs. 4.8% in normal lymph nodes (p = 3.8 e-05); in normal lungs was 18.3% contrasting with 60.4% in lung of sarcoidosis (p = 4.0 e-05). NAMPT mean proportions in lymph nodes were 12.7% in normal tissue and 52% in sarcoidosis (p = 4.9 e-04); while in normal lungs was 23.3% vs. 53% in sarcoidosis (p = 9.2 e-040. in lymph nodes).

