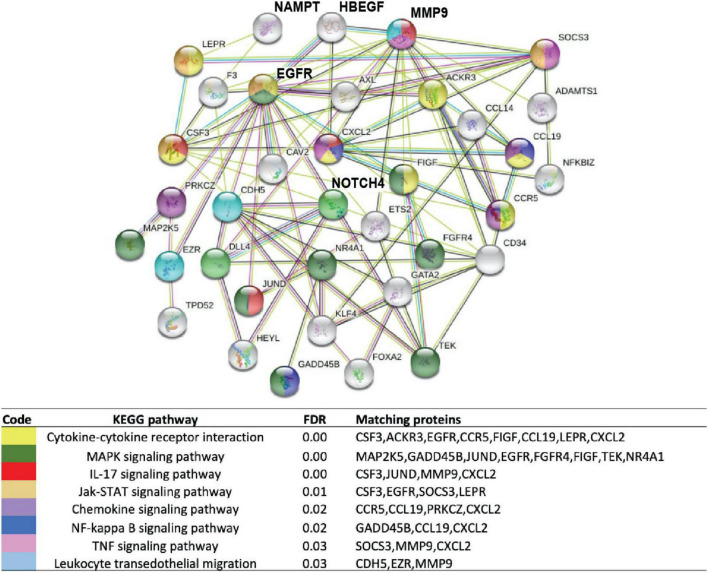
FIGURE 5.
Enrichment analysis of DEGs in lung tissues from subjects with sarcoidosis compared to healthy lung. Functional protein network interaction showing eNAMPT and HBEGF relationship with regulators of lung fibrosis (MMP9), inflammation, and lung remodeling and NOTCH4, a T-cell activity and angiogenesis regulator. Each node represents a coded protein. The edges represent protein–protein associations (line color indicates type of interaction: green—gene neighborhood, red—gene fusion, blue—co-occurrence, and black—co-expression). Pathway analysis and first shell interactors members included are indicated by the color code. A complete list of dysregulated pathways is presented in Supplementary Table 2.

