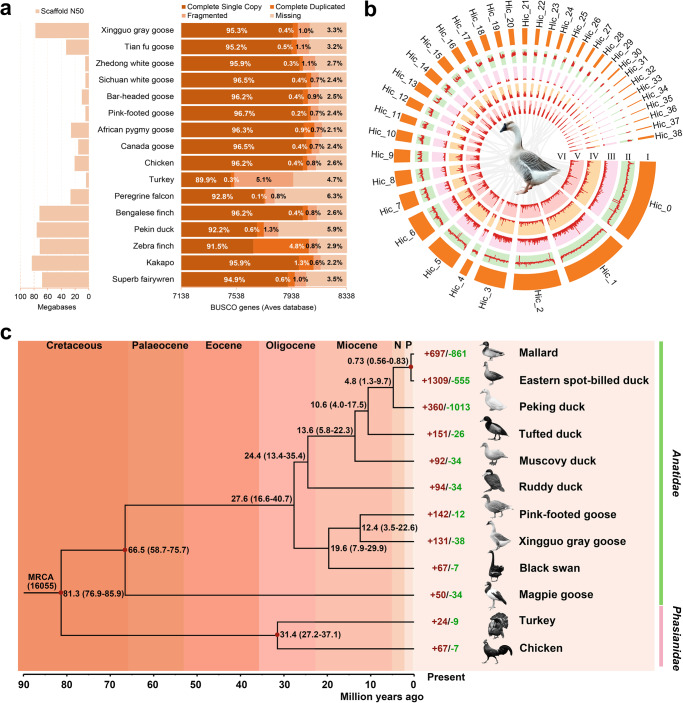
Fig. 2. Quality assessment of XGG genome and comparative genomic analysis.
a Quality assessment of avian genomes. The left is the size of scaffold N50 and the right is the results of the evaluation using BUSCO Genes of Aves Database. b Genome landscape of the XGG. I, Chromosome number; II, GC density in 100-kb sliding windows; III, Repeat density; IV, Gene density of positive-strand (+); V, Gene density of negative strand (–); VI, Paralogous relationships in XGG chromosomes. c Phylogenetic tree and gene family expansion-and-contraction analysis. The red and green numbers represent the significantly expanded and contracted gene families, respectively. Divergence time was estimated based on four calibration points (red circles). N Pliocene, P Pleistocene, MRCA most recent common ancestor.

