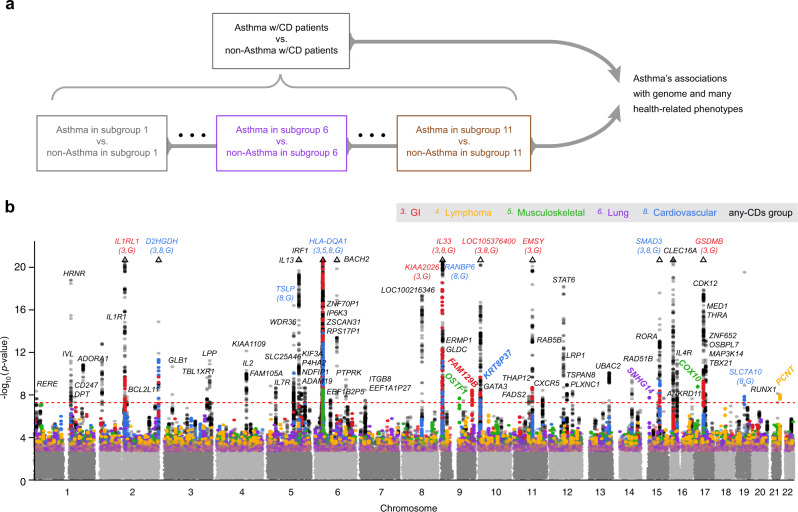
Fig. 2. Genome-wide significant associations with asthma.
a Study design for association analyses. Starting with the general population who may have any comorbid diseases (the any-CDs group) in UK Biobank, we were able to assign an individual with 1 of the 11 asthma subgroups that were found in UK Biobank. Then, we performed GWASs to identify asthma risk loci for the any-CDs group and for each subgroup individually (by comparing asthma cases against non-asthma controls within each subgroup). b GWAS Manhattan plots. This figure overlays GWAS results from the any-CDs group (in black) and from five selected subgroups (in multi-colors) that contained genome-wide significant asthma risk loci, including subgroups 3 “GI,” 4 “Lymphoma,” 5 “Musculoskeletal,” 6 “Lung,” and 8 “Cardiovascular.” All the association p values are shown on a –log10 scale on the y axis, and genomic locations are shown on the x-axis. The threshold of genome-wide significance (5 × 10⁻⁸) is indicated as a horizontal dashed line in red. Triangles at top indicate SNPs that have a higher –log10(p value) than shown. In addition, we annotate genome-wide significant loci with the names of their nearest genes, and in the case where a gene is commonly found in multiple subgroups and in the any-CDs group, the subgroup serial numbers and letter “G” are written, respectively, in parentheses under the gene name. In particular, we highlight the genes nearest to the six subgroup-specific loci by rotating their names with an angle of 45 degrees. More details can be found in Supplementary Table 1.

