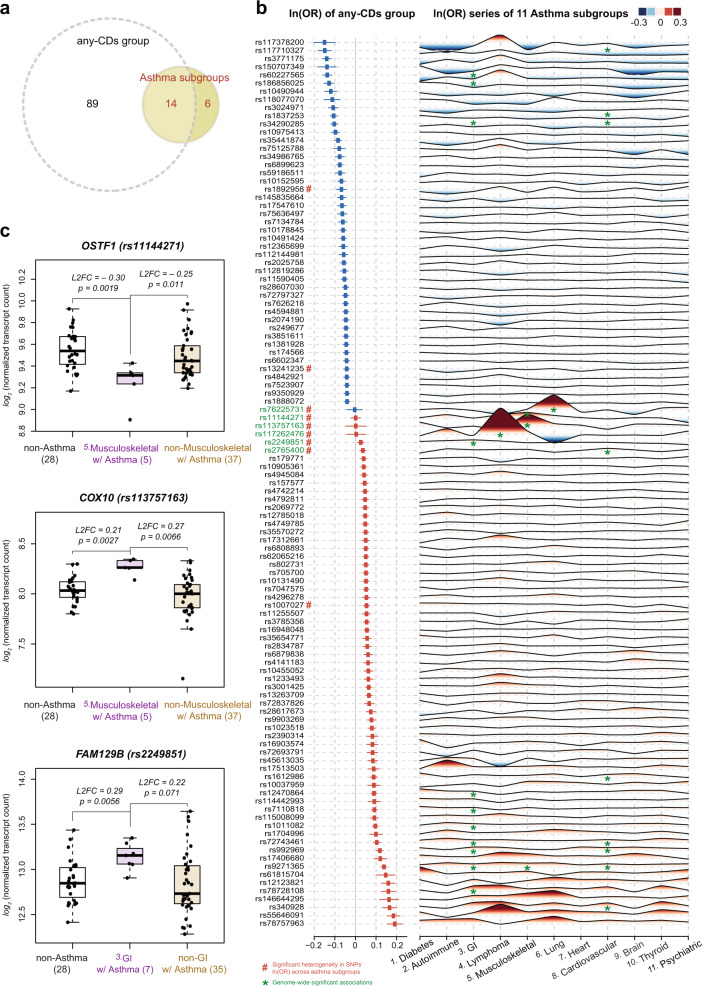
Fig. 3. Summary of genome-wide significant loci and differential gene expression.
a A summary of the significant loci in a Venn diagram. The association analysis by comparing asthma cases and non-asthma controls in the any-CDs group identified 103 independent loci at genome-wide significance level. Similar association analyses within each of the eleven asthma subgroups discovered 20 significant loci, of which 14 were also seen in the any-CDs group, and, interestingly, six more loci were specific to one subgroup only. Altogether there were 109 independent loci identified. b Association results for significant loci. The forest plot on the left side summarizes the association results seen in the any-CDs group for the 109 loci, at which the lead SNPs are listed in the first column. Squares denote the effect sizes, i.e., natural logarithm of odds ratios or ln(OR), and horizontal lines are the 95% confidence intervals. From top to bottom, the effect sizes are in ascending order, from negative (in blue) to positive values (in red). The wave-like plot on the right side displays a series of effect sizes seen in the eleven subgroups that can be found in UK Biobank for each of the 109 SNPs. The subgroup names are labeled along the horizontal axis, while for each of the 109 SNPs that are displayed along the vertical axis, its effect size is represented as a peak in the red shade if it is positive, and as a trough in blue shade if negative. The absolute value of the effect size is proportional to the height (or depth) of the peak (or trough), and is also color-coded. All the genome-wide significant associations between SNPs and subgroups are marked with green asterisks, and in particular, the six SNPs that are specific to one subgroup only are highlighted in green in the first name column. In addition, the heterogeneity of per-locus effect sizes across the eleven subgroups was assessed through a Cochran’s Q test, finding nine loci with evidence of significant heterogeneity in effect sizes (indicated with # symbols in red after the respective SNP names in the first column). See Supplementary Data 6 for the association results in detail and Supplementary Fig. 5 for the numbers of allocated cases and controls in each subgroup. c Differential gene expression. For three of the subgroup-specific SNPs, we confirmed the differential expression of their nearby genes (i.e., OSTF1, COX10, and FAM129B), using an independent dataset of bronchial epithelial transcriptome profiles. The gene OSTF1, for example, has significantly lower expression among asthma cases in subgroup 5 “Musculoskeletal”, compared to non-asthma controls and asthma cases in other subgroups (see the x axis labels and respective sample sizes in parentheses). The y-axis shows the normalized transcript count on a log2 scale, i.e., log2[(transcript count+0.5)/size factor]; the minimum, the first quartile, the median, the third quartile, and the maximum of OSTF1 for non-asthma controls are 9.17, 9.42, 9.54, 9.67, and 9.93, for asthma cases in subgroup 5 are 8.91, 9.24, 9.31, 9.34, and 9.43, and for asthma cases in other subgroups are 9.20, 9.34, 9.45, 9.59, and 9.97; these values of COX10 for non-asthma controls are 7.80, 7.97, 8.03, 8.12, and 8.30, for asthma cases in subgroup 5 are 8.14, 8.26, 8.26, 8.33, and 8.35, and for asthma cases in other subgroups are 7.15, 7.86, 8.00, 8.09, and 8.33; these values of FAM129B for non-asthma controls are 12.41, 12.71, 12.85, 13.01, and 13.44, for asthma cases in subgroup 3 are 12.91, 13.06, 13.15, 13.23, and 13.35, and for asthma cases in other subgroups are 12.28, 12.62, 12.73, 13.04, and 13.64). The mean log2 fold changes (L2FC) of OSTF1 in subgroup 5 of asthma cases were −0.30 (two-sided Wald statistic p value = 0.0019) and −0.25 (p value = 0.011), when compared to non-asthma controls and asthma cases in other subgroups, respectively. The other comparisons show that bronchial epithelial cell expression of COX10 in subgroup 5 “Musculoskeletal” and FAM129B in subgroup 3 “GI” are significantly higher, compared to non-asthma controls and their respective asthma cases in other subgroups.

