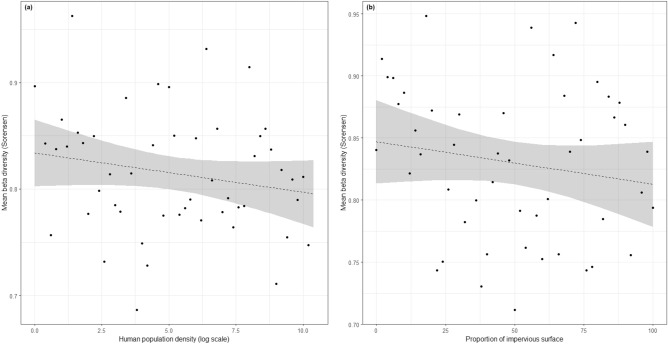
Figure 2.
Graphs from the beta diversity model, representing (a) the mean pairwise beta diversity between sites having a log human population density (x-axis, log scale) of x and x + 0.2 and (b) the mean pairwise beta diversity between sites having a proportion of impervious surface (x-axis) of x and x + 2. The line represents model prediction (dashed if not significant, α = 5%) and the shaded areas around is the 95% confidence interval of these predictions.

