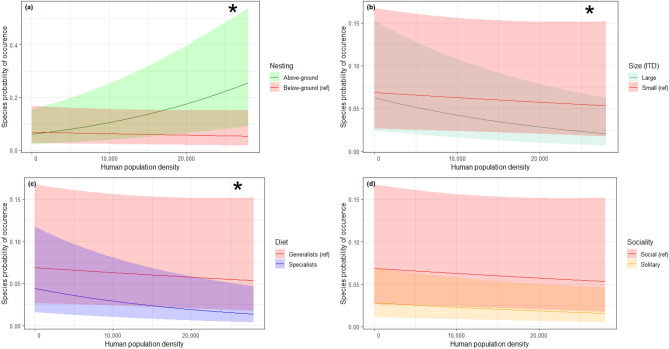
Figure 3.
Bee species probability of occurrence as a function of human population density and functional trait modalities. Model predictions are plotted separately by trait modalities, so as to highlight the statistical interactions that may support an ecological filter hypothesis, i.e. different slopes between two modalities of a given trait. In each panel, the reference modality handled by the model (red curves, with a “ref” legend tag) was chosen on the basis of the most abundant species in the dataset, namely Lasioglossum malachurum, a small-sized species nesting below ground, with generalist diet and social habits. Shaded areas stand for the 95% confidence interval of these predictions. The plots labelled with an asterisk indicate a significant trait modality-human population density interaction.

