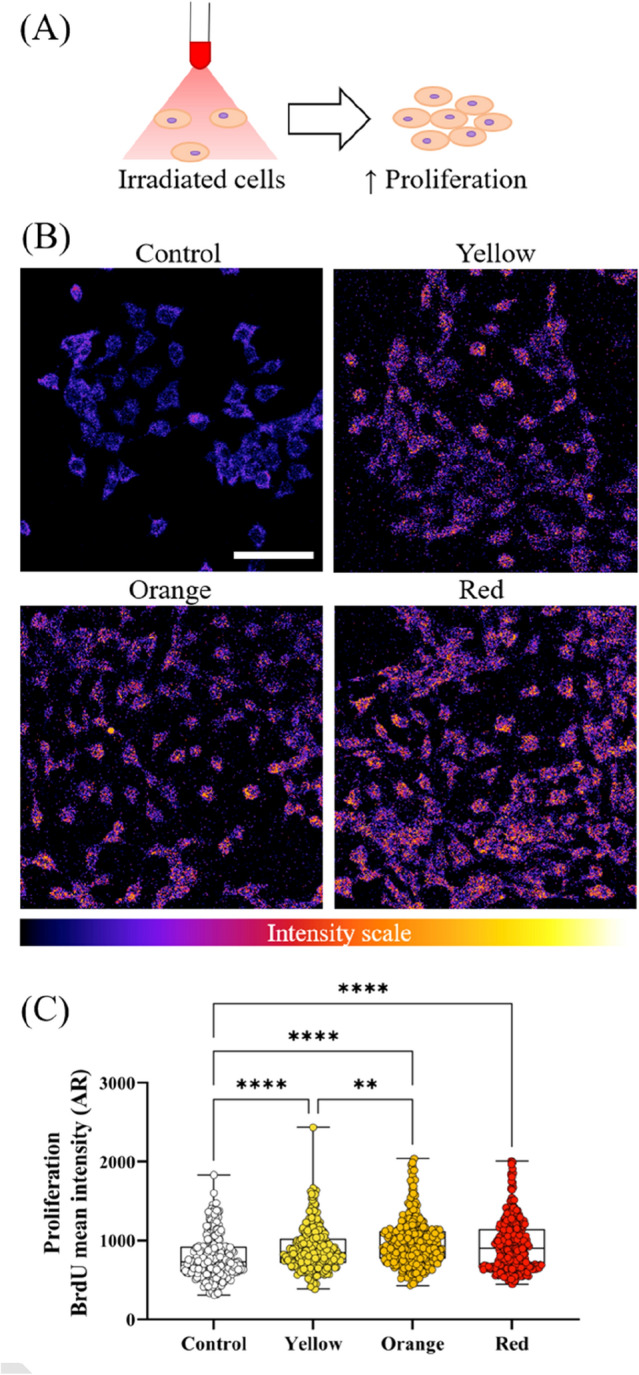
Figure 3.

Effect of visible light exposure on HaCaT proliferation. (A) Immunofluorescent images of BrdU incorporation into HaCaT cells. BrdU intensity is shown as a colour scale with low intensities appearing more blue and high intensities appearing more purple and orange. (B) HaCaT proliferation increases when exposed to visible light. (C) Quantitative analysis of BrdU intensity. Each dot represents a single cell and at least 240 cells across four independent experiments have been analysed. Boxes show median, first and third quartiles. Scale bar in B represents 100 μm. **P < 0.01, ****P < 0.0001, ordinary one-way ANOVA multiple comparisons test.
