
FIGURE 3.
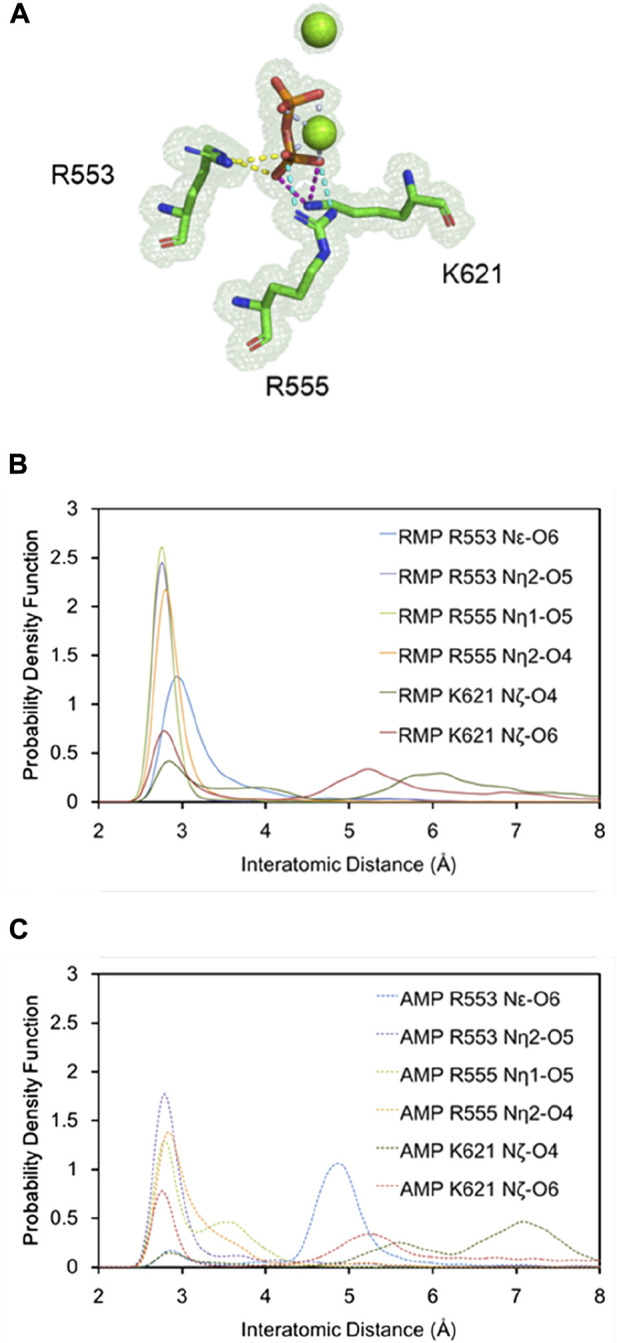
Detailed H-bonding interactions for PPi. (A) A close-up view of the MD-derived ED maps for PPi and interacting residues. (B,C) PDFs of the H-bond distance distribution for PPi and interacting residues with RMP (B, solid curves) and AMP (C, dashed curves) at position i + 3.