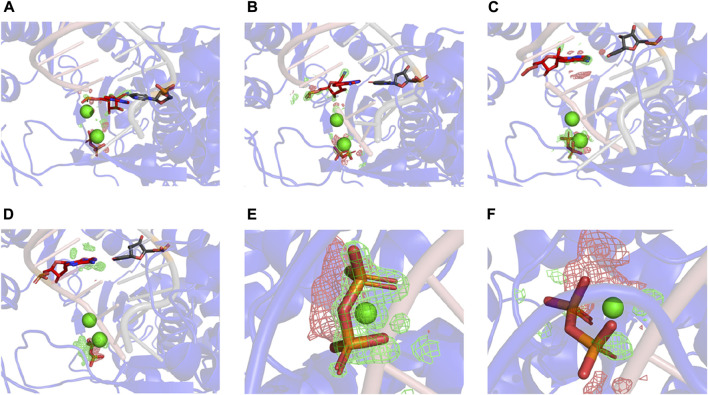
FIGURE5.
Differences between RMP and AMP complexes determined using difference ED maps. (A–C) Difference ED maps between RMP and AMP for the three paired structures. RMP complexes are aligned to the difference map. Green mesh indicates positive and red mesh indicates negative (contoured at ± 15σ). (D) I+3 AMP complex aligned to the difference map. (E,F) Close-up views of PPi of i + 3 and i + 2 complex.

