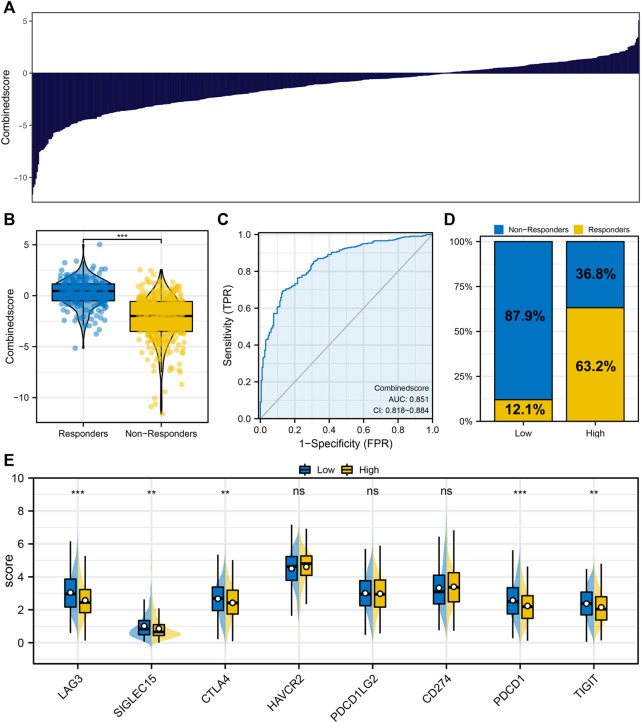
FIGURE 3.
Logistics regression model. Notes: (A) Logistic regression model was constructed based on the identified characteristic genes; (B) Differences of logistics score between immunotherapy responders and nonresponders; (C) ROC curve was utilized to assess the performance of Logistics score in predicting the response to immunotherapy in LUAD patients; (D) Proportion of immunotherapy responders and non-responders in patients with high and low logistics score; (E) The level of key immune checkpoints in patients with high and low logistics score.

