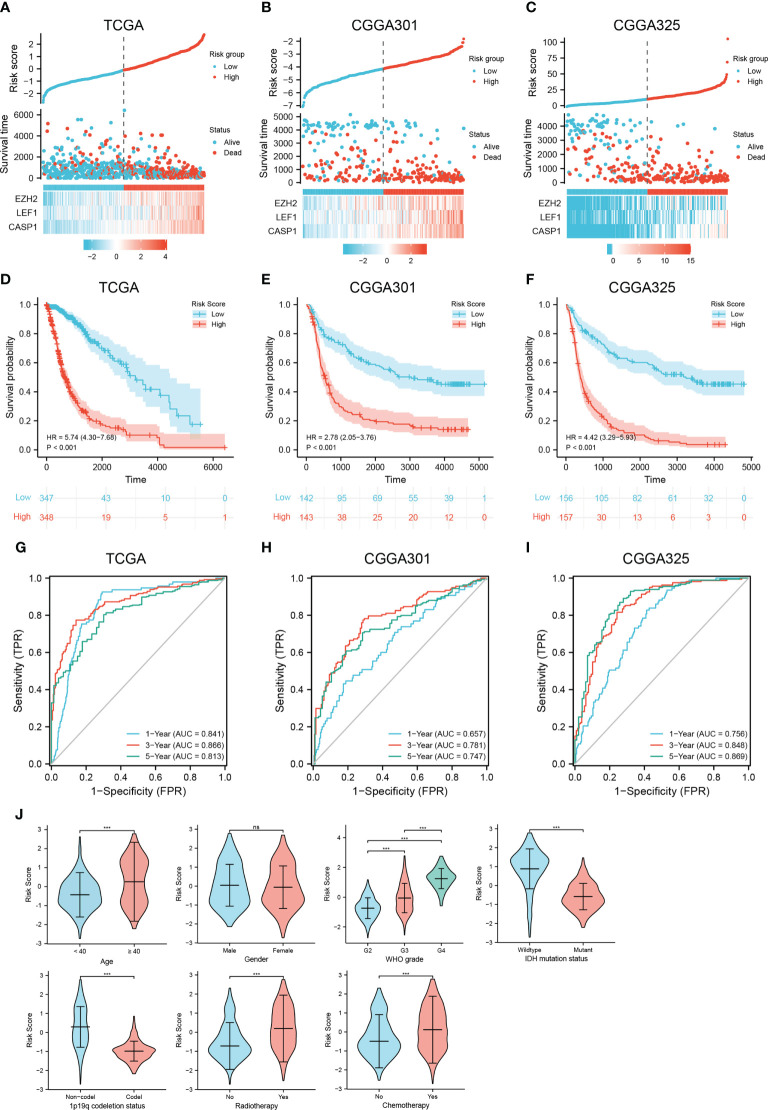
Figure 3.
Construction and validation of a necroptosis-related risk model and its association with clinicopathologic features. (A–C) The risk score, survival distributions, and expression heatmaps of EZH2, LEF1, and CASP1 in the TCGA and CGGA cohorts. (D–F) Kaplan-Meier survival analysis based on the necroptosis-related risk model in the TCGA and CGGA cohorts. (G–I) ROC curves predicting 1-, 3-, 5-year OS of glioma patients in the TCGA and CGGA cohorts. (J) The associations between the necroptosis-related risk model and clinicopathological features (*** p < 0.001; ns, not significant).

