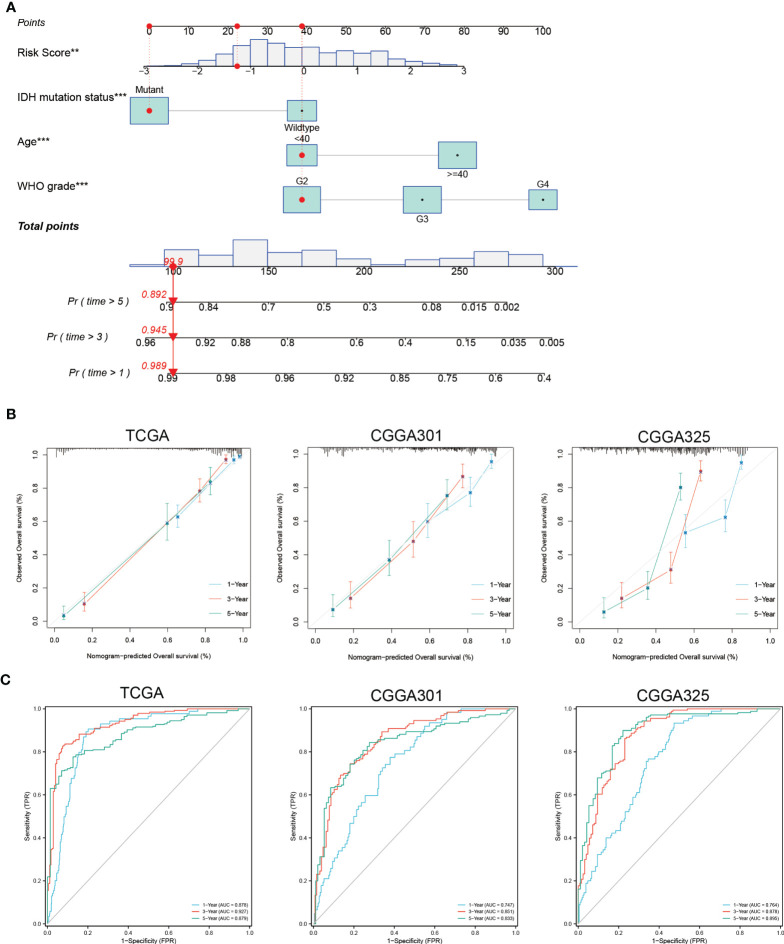
Figure 4.
Construction and validation of nomogram based on independent prognostic factors of glioma. (A) Prognostic nomogram to predict the 1-, 3-, and 5-year OS of glioma patients. Red dots represent one case from the TCGA training set. (B) The 1-, 3-, and 5-year calibration curves for the nomogram in the TCGA and CGGA cohorts. The x-axis and y-axis represent nomogram predicted and actual survival, respectively. The 45-degree gray line represents perfect calibration. (C) The 1-, 3-, and 5-year ROC curves for the nomogram in the TCGA and CGGA cohorts. **p < 0.01; ***p < 0.001

