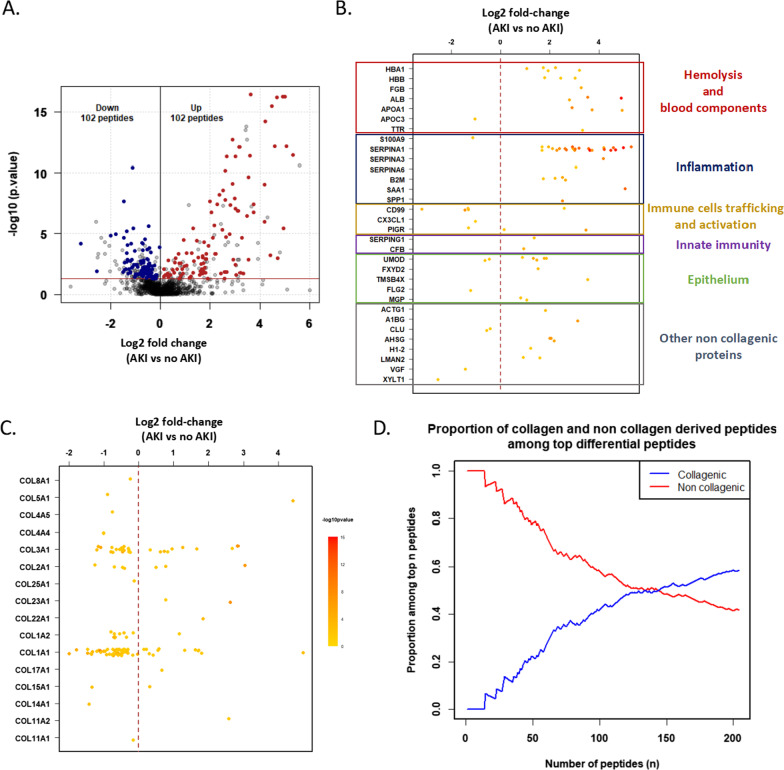
Fig. 3.
Urinary peptidome changes during CBP-surgery-induced AKI. A. Peptides with significantly different abundances in AKI patients. The volcano plot displays log10-transformed and adjusted univariate p values as a function of log2-transformed fold changes of urinary peptides amplitudes. Sequenced peptides with differential abundances (significant after Benjamini–Hochberg adjusted Wilcoxon univariate testing (p < 0.05)) are represented in color (more abundant: red; less abundant: blue). B. Peptides with significantly different abundances (in respect to distribution frequency and amplitude signal) derived from non-collagenic proteins (y position), log2 fold changes (x position), and –log10 adjusted p values (color scale). The brown dashed line represents log2 fold change = 0. Peptides are ranked according to their functional role during the AKI progression (inflammation, epithelium, blood component, other non-collagenic proteins). C. Peptides with significantly different abundances derived from collagenic proteins (y position), log2 fold changes (x position), and –log10 adjusted p values (color scale). The brown dashed line represents log2 fold change = 0. D. Collagenic and non-collagenic proteins-derived peptides proportions among top differential peptides according to the Benjamini–Hochberg adjusted p value ranking. The red line corresponds to non-collagen and the blue line to collagen-derived peptides

