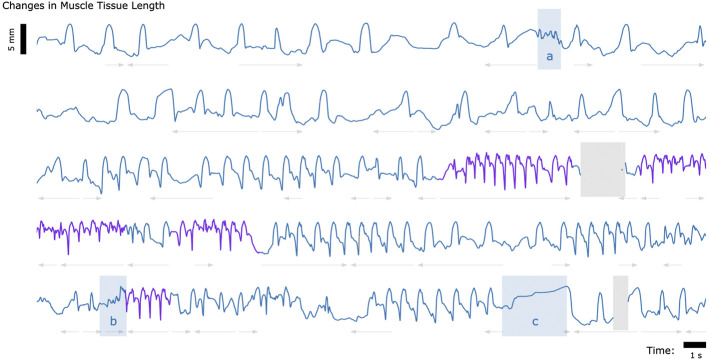
FIGURE 5.
Muscle Tissue Length During Free Roaming Movement. Magnetomicrometry data was continuously collected for 150 s during free roaming activity. Muscle tissue length is plotted in blue during standing and walking and plotted in purple during running. Blue highlighted regions indicate muscle tissue length during (a) feather ruffling, (b) jumping, and (c) balancing on one leg. Gray arrows indicate when the turkey was turning left (left arrows) or turning right (right arrows). Gaps due to wireless transmission packet drops are shown in gray, as described in Figure 2.

