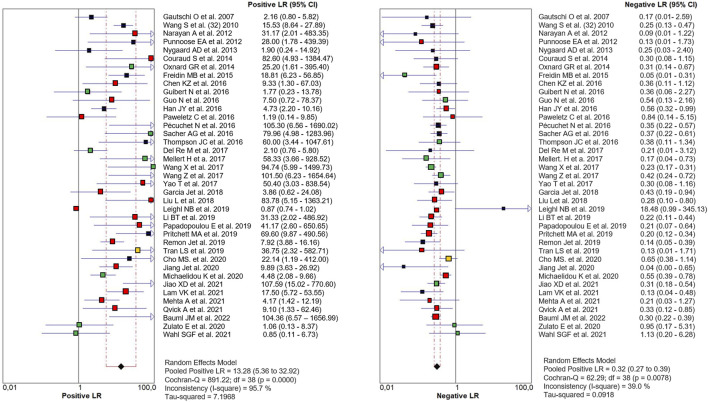
FIGURE 3.
Paired Forest plot of PLR and NLR of cfDNA testing in detecting KRAS mutation in NSCLC for 39 studies in the meta-analysis. Random-effects (RE) model used. The square and horizontal bars represented study-specific PLR and NLR and 95% confidence interval (CI). Squares in different colors represent a different diagnostic method (red = Targeted NSG; blue = ddPCR; yellow = both; black = other method). Diamonds represented the overall results. The pooled PLR and NLR were 8.32 (95% CI 6.93–9.99) and 0.29 (95% CI 0.26–0.33), respectively.

