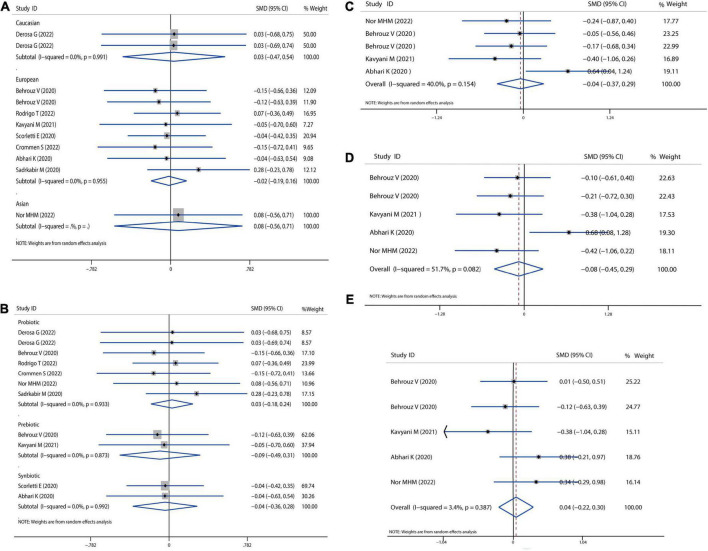
FIGURE 2.
Forest plot of the effect of microbiota therapies on BMI and dietary intake in patients with NAFLD. (A) The effect of microbiota therapies on BMI based on different ethnicity. (B) The effect of microbiota therapies on BMI based on different interventions. (C) The effect of microbiota therapies on the intake of energy. (D) The effect of microbiota therapies on the intake of carbohydrates. (E) The effect of microbiota therapies on the intake of fat. For each study, the estimated mean changes and the 95% CI are plotted with a diamond and a horizontal line, respectively.

