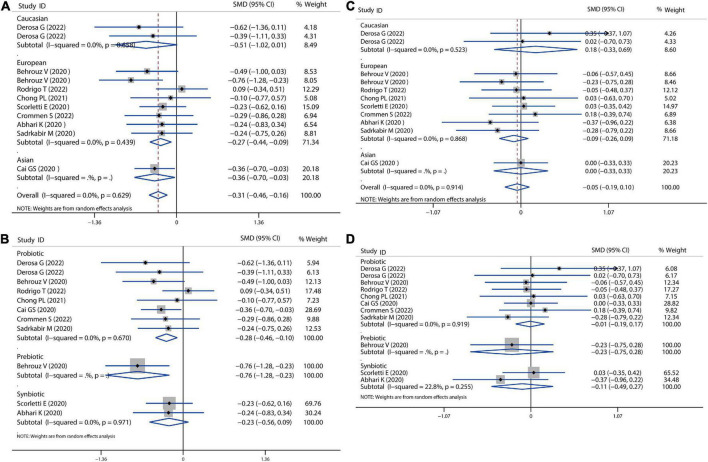
FIGURE 5.
Forest plot of the effect of microbiota therapies on LDL-c and HDL-c in patients with NAFLD. (A) The effect of microbiota therapies on LDL-c based on different ethnicity. (B) The effect of microbiota therapies on LDL-c based on different interventions. (C) The effect of microbiota therapies on HDL-c based on different ethnicity. (D) The effect of microbiota therapies on HDL-c based on different interventions. For each study, the estimated mean changes and the 95% CI are plotted with a diamond and a horizontal line, respectively.

