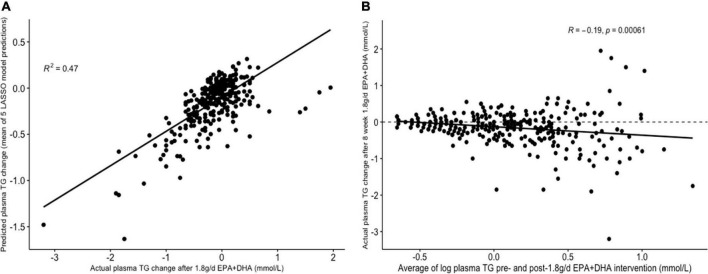
FIGURE 4.
Graphs depicting results from supervised analysis with plasma TG change after 1.8 g/day EPA + DHA as intervention. (A) Scatter plot comparing actual TG change against predicted TG change using the LASSO model, averaged across all imputed datasets; (B) scatter plot depicting the correlation between the average of logged plasma TG values pre- and post-1.8g/day EPA + DHA intervention with observed TG change. Dashed line represents no change. LASSO, Least Angle Selection and Shrinkage Operator; TG, triglyceride.

