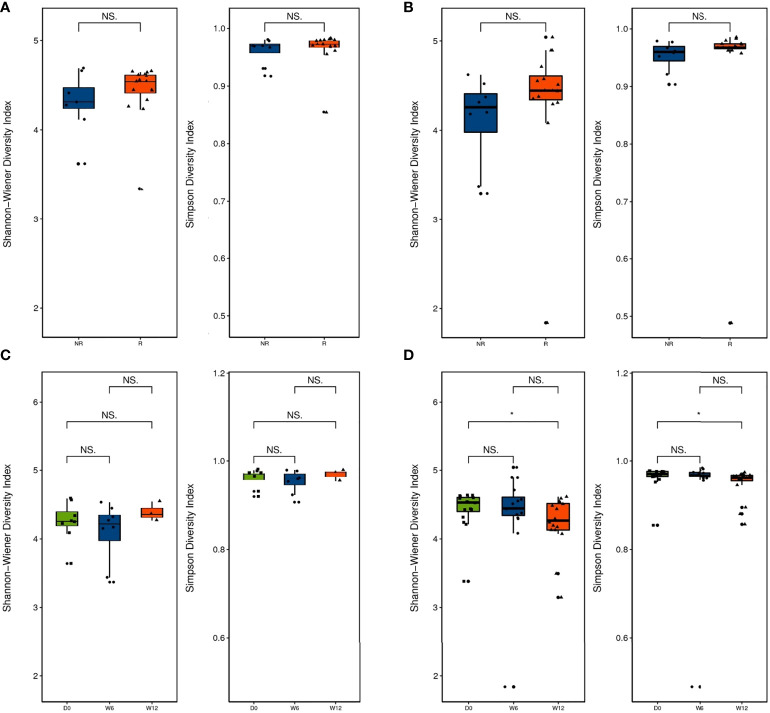
Figure 2.
Diversity of the gut microbiota between the R group (n = 16) and NR group (n = 8, except at 12 weeks). (A) Alpha diversity was evaluated by the Shannon and Simpson indices at baseline and (B) 6 weeks. (C) Comparison of alpha diversity by the Shannon and Simpson indices at baseline, 6 weeks, and 12 weeks in the R group and (D) the NR group (n = 3 at 12 weeks). NS and *indicate values of P > 0.05, P < 0.05, respectively.

