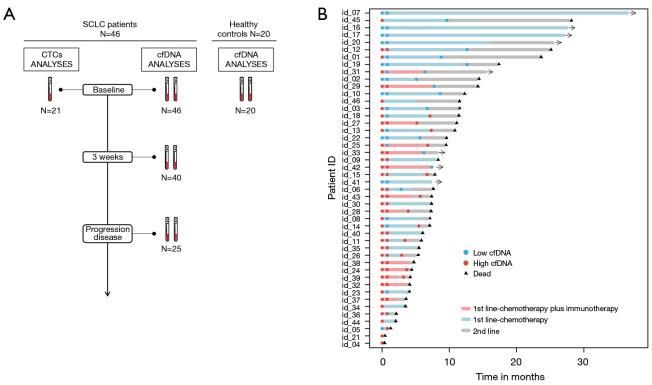
Figure 1.
Study schema and clinical course of all patients included in the study. (A) Study sampling points and cohorts. (B) Swimmers’ plot showing each patient therapy and the different times of sample collection. The total length of each bar indicates the duration of survival from the diagnoses. Alive patients are represented with the black arrow head. SCLC, small cell lung cancer; cfDNA, cell free DNA; CTCs, circulating tumor cells.

