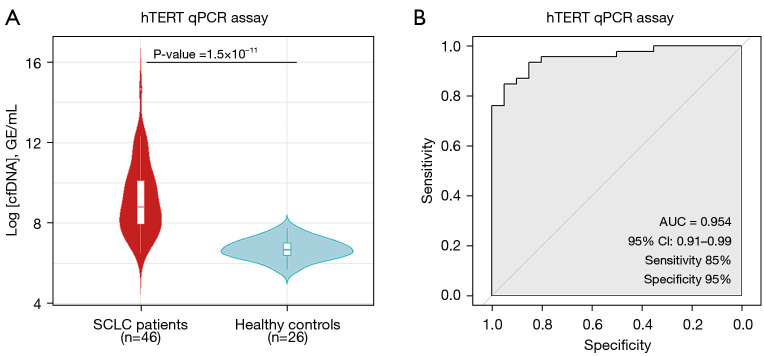
Figure 2.
cfDNA levels are higher in SCLC patients than healthy controls. (A) Total cfDNA levels in healthy controls and patients with SCLC. Statistical analysis between both groups was performed by the Mann-Whitney-Wilcoxon U-Test. (B) ROC curve for qPCR assay shows high sensitivity and specificity to discriminate healthy controls and SCLC patients. qPCR, quantitative PCR; cfDNA, cell free DNA; CI, confidence interval; GE, genomic equivalents; SCLC, small cell lung cancer; AUC, area under the curve; ROC, receiver operating characteristic.

