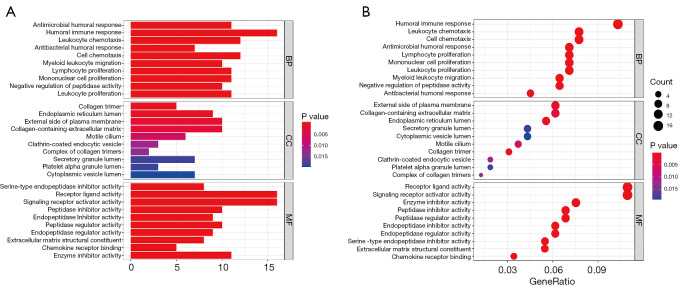
Figure 5.
Functional annotation for DEGs between the high and low-risk groups using GO enrichment analysis. (A) The bar plot and (B) bubble plot showing the significantly enriched GO pathways. The bubble color representing the P value, and the bubble size representing the number of genes in the relevant pathway. BP, biological process; CC, cellular component; MF, molecular function; DEGs, differentially expressed genes; GO, Gene Ontology.

