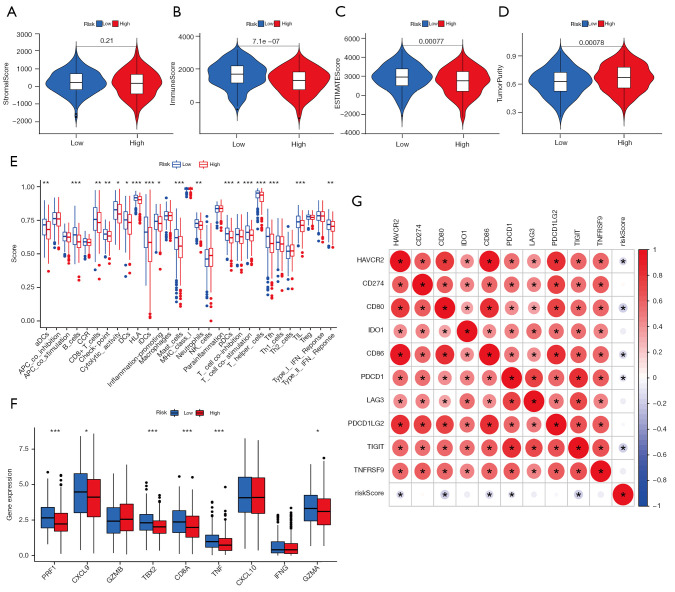
Figure 6.
TME characteristics in the high- and low-risk groups. (A-D) Difference in the (A) stromal score, (B) immune score, (C) estimate score, and (D) tumor purity between the two groups. (E) Difference in the levels of 29 TME signatures between the two groups. (F) Difference in the immune-activation related gene expression between the two groups. The horizontal line indicates the median, the lower and upper boundaries of the boxes the interquartile range, and the dots the outliers. Asterisks indicate statistical significance, *, P<0.05; **, P<0.01; ***, P<0.001. (G) Correlations between the risk score and immune-checkpoint related gene expression. Positive correlation was marked with red and negative correlation with blue. The circle color represents Spearman coefficient value, the size of circle is inversely proportional to the P value, and the * stands for P<0.001. TME, tumor microenvironment.

