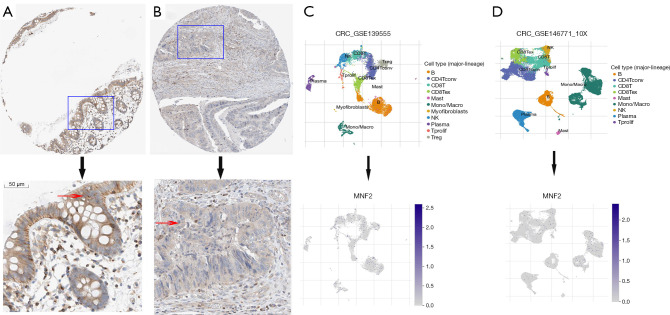
Figure 2.
The MFN2 expression detected by immunohistochemistry and single cell RNA-seq analysis of the colon cancer. (A,B) Representative immunohistochemical staining in colon normal tissues (A) and colon cancer tissues (B). The red arrow indicates the stained area of the gland. (C) From dataset GSE139555, an t-SNE plot showing 11 cell clusters (up) and MFN2 expression levels in various clusters (down). (D) The t-SNE plot showing 9 cell clusters (up) and expression levels of MFN2 in different clusters from dataset GSE146771 (down). MFN2, mitofusin 2; CRC, colorectal cancer; RNA-seq, RNA sequencing; t-SNE, t-distributed stochastic neighbor embedding; CD4Tconv, conventional CD4+ T cells; CD8T, CD8 T lymphocytes; CD8Tex, exhausted CD8 T cells; Mono/Macro, monocyte/macrophage; NK, natural killer; Tprolif, proliferative T cells; Treg, regulatory CD4+ T cell.

