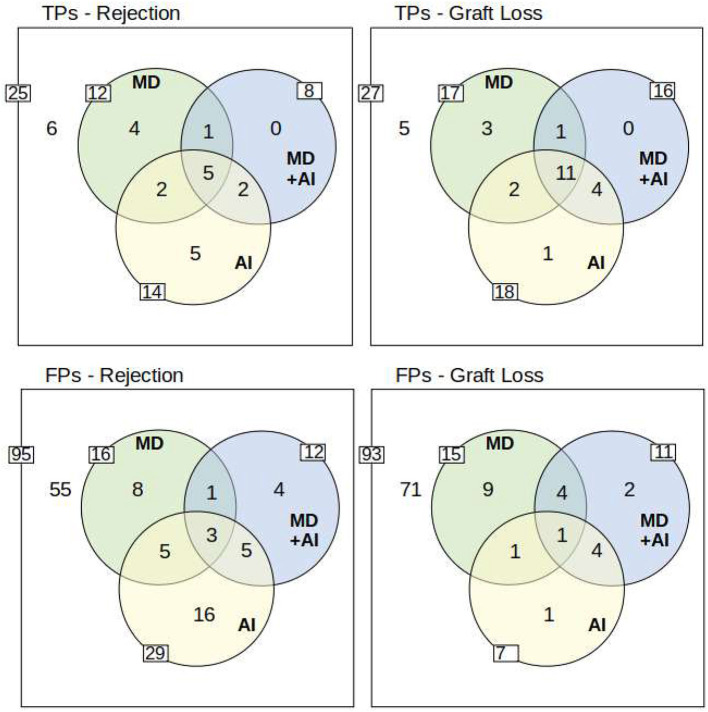
Figure 4.
Overview of True Positives (TP) and False Positives (FP). The outer white rim describes the number of positives/negatives for each endpoint. The inner side of each circle indicates the number of true/false positives of AI, MD, and MD + AI. Moreover, the overlapping circles show the overlaps of true/false positive predictions between the different participants. The yellow circle of the AI system represents data points which were flagged with a yellow or red traffic light in the dashboard. To understand the example, take for instance TPs-Rejection: Overall 25 rejections (25 positives of 120 data points) occurred, from which 6 have not been detected by anyone in the study. AI predicted 14 (5 + 2 + 5 + 2) correctly, while MD predicted 12 (4 + 1 + 5 + 2), and MD+AI predicted 8 (1 + 5 + 2) correctly. Five TPs are predicted by all (see intersection of all three circles). Moreover, two TPs are predicted only by MD and AI, and two other TPs only by MD + AI and AI. Only one TP is identified by MD and MD + AI. Finally, 4 TPs are predicted correctly only by MD, and 5 other TPs only by AI. MD + AI does not predict any additional TP which is already found by MD or AI. The lower row presents the same scenario for falsely predicted data points. A more detailed overview including also the results for the red and yellow warning of the traffic light system is included in the Supplementary material.

