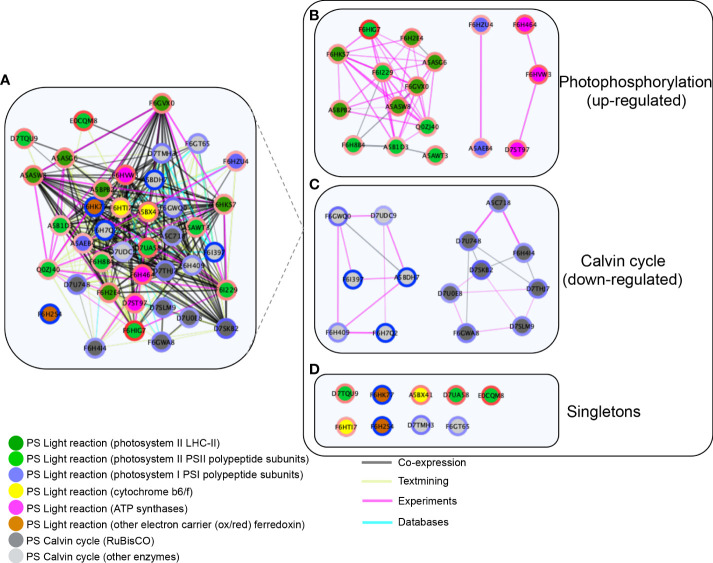
Figure 6.
Network protein–protein interactions of differentially accumulated proteins (DAPs) in the chloroplasts of Vitis vinifera cv. Vinhão exocarp at the mature stage (E-L 38) vs. the green stage (E-L 34). (A) Functional association cluster network. Network limited to “physical interaction” clusters. (B) Photophosphorylation-involved proteins; (C) Calvin cycle involved proteins, and (D) Singletons. LogFC ratios of protein abundance between the green and mature stages were mapped around the nodes using a blue (negative) and red (positive) color gradient. The inner nodes were colored according to the MapMan bins. The edge scores are visualized by co-expression (black), co-occurrence (blue), experiments (pink), and textmining (light green). The network clusters were obtained using Markov clustering on the STRING network of proteins from panel (A). Proteins were named according to their canonical name.

