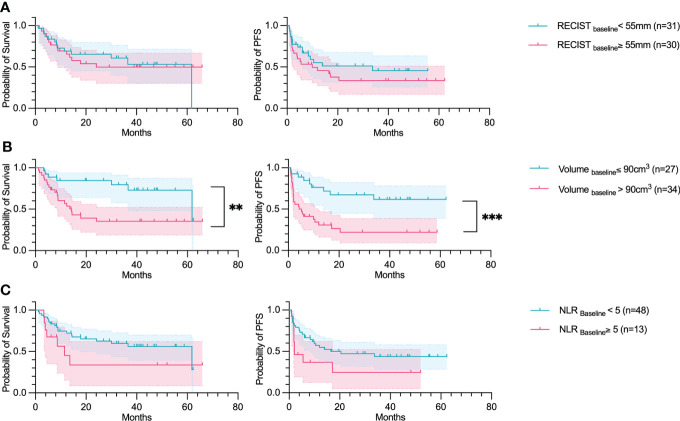
Figure 2.
Volumebaseline predicts OS and PFS. Overall survival and Progression-free survival plotted using a Kaplan Meier estimation with their respective confidence intervals (95%). The parameters studied are: (A) The sum of RECIST diameters (RECIST); (B) Total tumor volume (Volume); and (C) Neutrophil-to-lymphocyte ratio (NLR). For Kaplan–Meier estimation, tick marks represent data censored at the time of the last imaging assessment and statistical analyses were performed using Log-rank (Mantel-Cox) test. Symbol significance: * p ≤ 0.05; ** p ≤ 0.01; *** ≤0.001, **** ≤0.0001.

