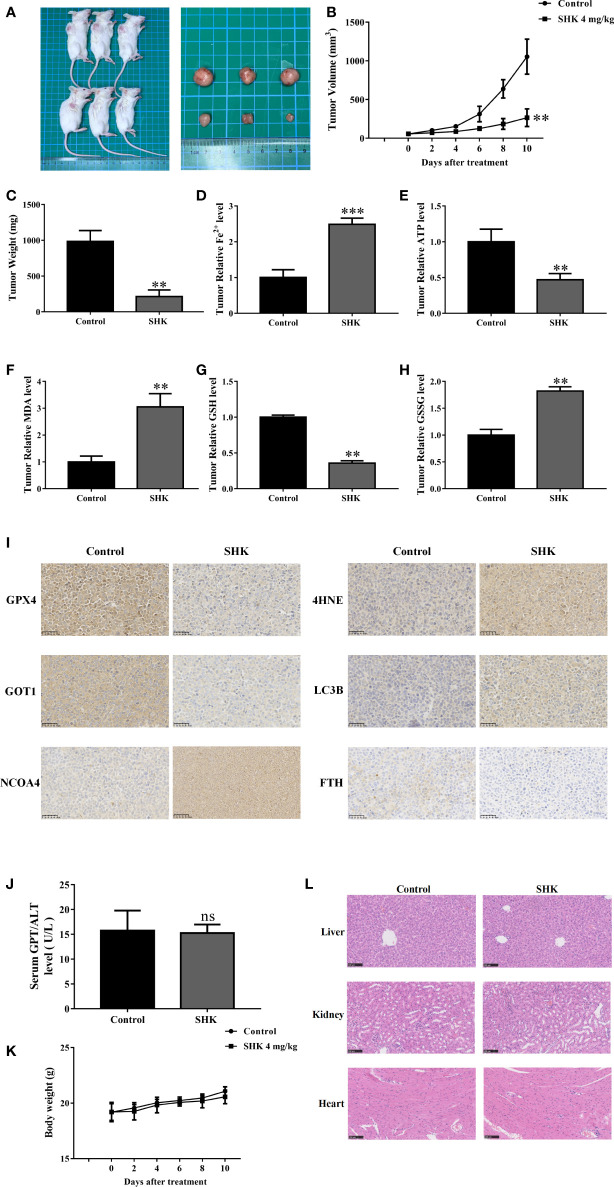
Figure 6.
SHK results in ferroptosis induction and exerts antitumor efficacy in vivo. (A) Representative image of RPMI 8226 xenograft tumors after SHK treatment. (B) Tumor volume in each group. (C) Tumor weight in each group. (D) Tumor Fe2+ in each group. (E) Tumor ATP level in each group. (F) Tumor MDA level in each group. (G) Tumor GSH level in each group. (H) Tumor GSSG level in each group. (I) IHC staining were used to assess GPX4, 4HNE, GOT1, NCOA4, FTH1 and LC3B levels in tumor tissues. (J) Serum ALT in each group. (K) Body weight in each group. (L) HE stain in liver, kidney and heart of each group. Data are presented as the mean ± SD. ns, not significant; **p < 0.01, ***p < 0.001.

