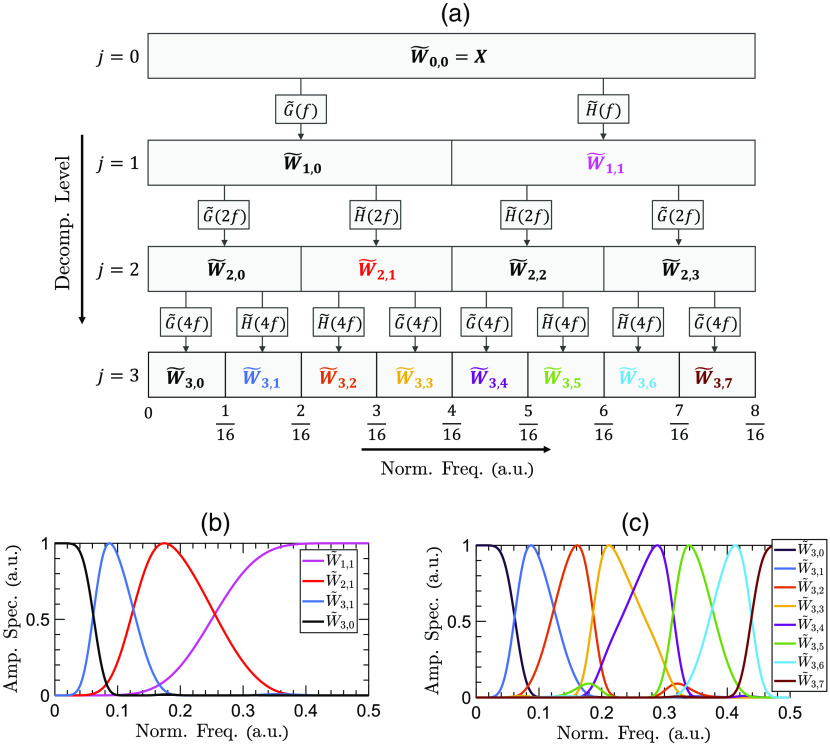
Fig. 2.
(a) The scale-frequency diagram of MODWPT. The first rectangle at level represents the entire spectrum of the original THz signal, . At subsequent decomposition levels, the spectrum is divided into sub-bands of equal bandwidth by filtering the sub-bands of the previous stage with a pair of scaling and wavelet filters. The amplitude spectrum of the sub-bands are plotted for (b) MODWT and (c) MODWPT over levels of decomposition.

