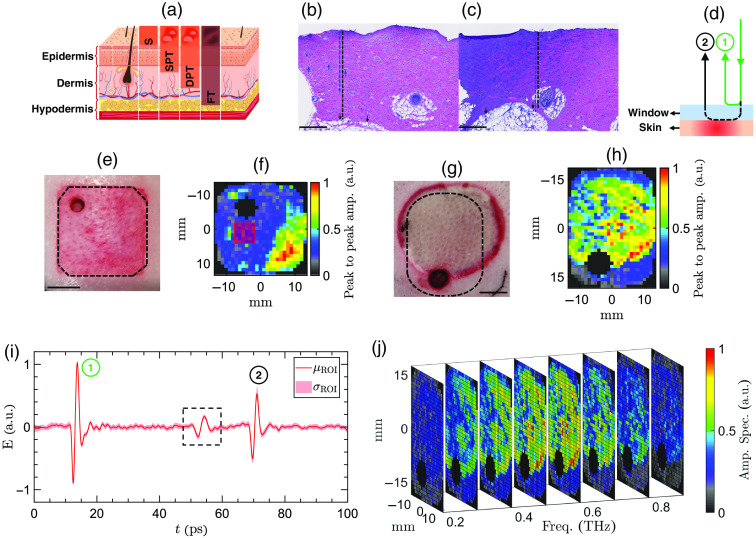
Fig. 4.
(a) The anatomy of the skin layers, composed of epidermis, dermis, and hypodermis. Burn injuries can be divided into superficial (S), SPT, DPT, and FT groups, depending on the extension of the dermal burn depth. (b), (c) Two example microscopic images of the biopsy slices (H&E stained), extracted from a DPT and an FT burn, respectively. The blue arrows point at damaged microvasculature or necrotic cells, and the black ones point at the full dermis margin. (d) A schematic of the measured reflection pulses in the PHASR scanner. (e), (f) The images of an example contact burn obtained using a digital camera and the PHASR scanner, respectively. The color axis represents the peak-to-peak amplitude of the time-domain THz reflections at the burn and imaging window interface. (g)–(h) Similar to (e) and (f) for an example scald burn. (i) The mean and standard deviation of the pulses of an ROI delineated by a red square in (f). (j) A sub-sampled representative 3D data cube composed of spectral images of the burn in (g). The color axis is the normalized amplitude spectrum obtained by the Fourier transform of the THz pulses.

