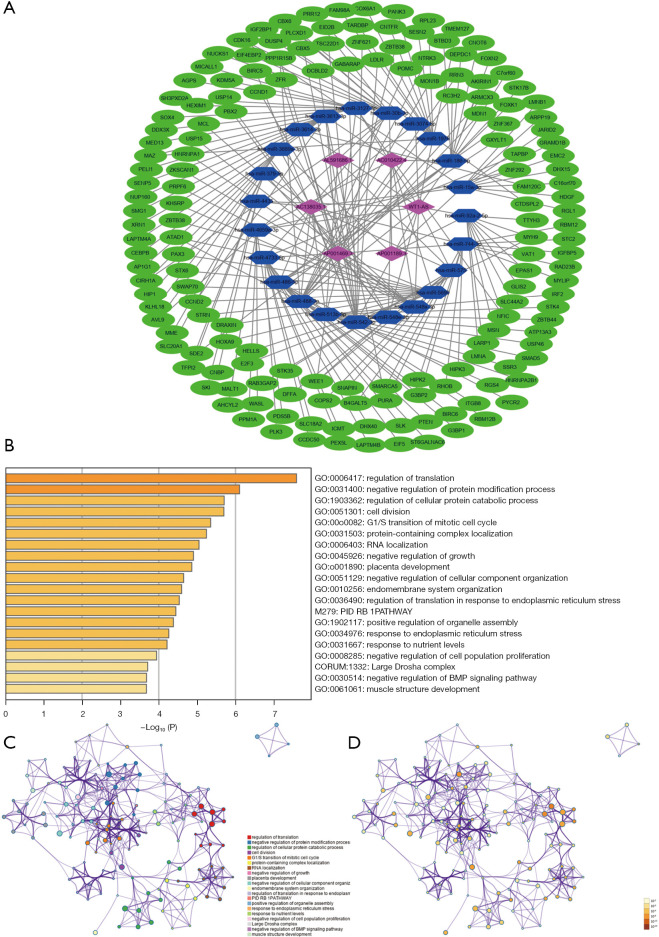
Figure 8.
CeRNA network and functional enrichment analysis. (A) CeRNA network of the m6A-related lncRNAs and the predicted miRNAs and mRNAs. (B) Bar chart of the enriched pathways, colored according to the P values. (C,D) Network of enriched terms, according to cluster ID (C) and P value (D). ceRNA, competing endogenous RNA; m6A, N6-methylandenosine; lncRNA, long non-coding RNA.

