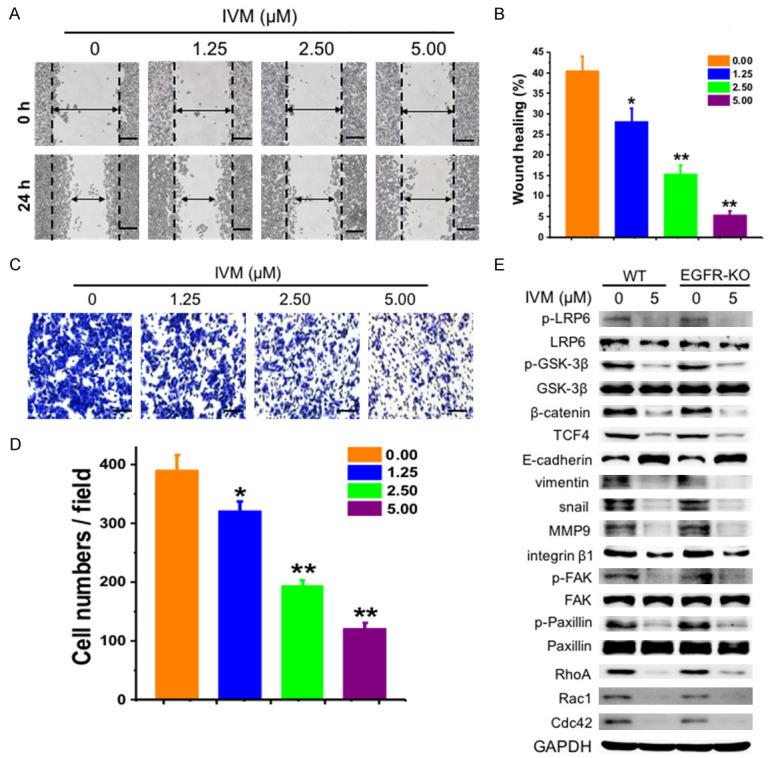
Figure 12.

IVM inhibited the migration of EGFR-knockout HCT-116 cells (EGFR-KO). (A and C) Wound healing assay (A) and transwell migration assays (C) were assessed at 0 h and 24 h or 48 h, respectively, after HCT-116 EGFR-KO cells were treated with different concentrations of IVM. Scale bar = 250 μm. (B) Quantitation of scratch assay as described in Figure 1. (D) Quantitation of transwell migration assay. (E) The activation of integrin β1/FAK and Wnt/β-catenin pathway, and the expression of their downstream signaling molecules in HCT-116 (WT) and HCT-116 EGFR-KO cells treated with 5 μM IVM for 48 h was determined by Western blotting analysis using GAPDH as internal control. The numbers in the figure keys represented the concentrations (μM) of IVM. Cells treated with vehicle served as control. Data in the histograms were presented as the mean ± SD (n = 3). The blots shown in (E) were representative of two independent experiments. *P < 0.05, **P < 0.01, compared with their respective controls.
