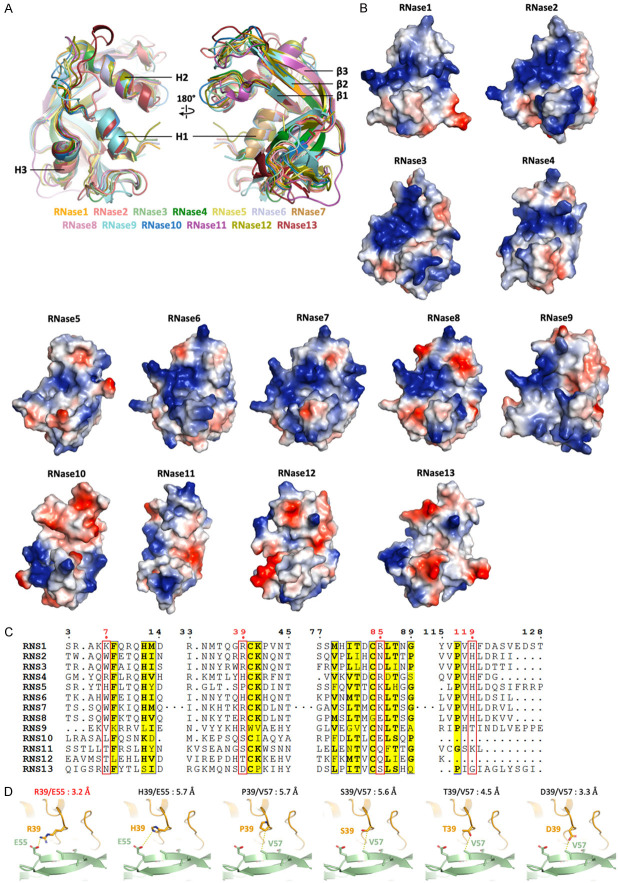
Figure 3.
Surface charge distribution of the RNases is related to its enzymatic activity and plays the key role in RTK receptor recognition. A. Superimposition of published crystal structures of RNase1 (PDB ID: 1DZA), RNase2 (PDB ID: 1HI2), RNase3 (PDB ID: 1DYT), RNase4 (PDB ID: 1RNF), RNase5 (PDB ID: 1ANG), RNase6 (PDB ID: 4X09), RNase7 (PDB ID: 2HKY), RNase8 (AlphaFold model), RNase9 (AlphaFold model), RNase10 (Phyre2 [54] model), RNase11 (Phyre2 model), RNase12 (AlphaFold model) and RNase13 (AlphaFold model). The highly conserved secondary structures are labeled. B. Surface charge distribution from RNase1 to RNase13 shows the positively- (blue) and negatively-charged (red) residues. Models are aligned to the same orientation. C. Multiple sequence alignment of human RNases 1-13. Sequences from UniProt are RNS1 (P07998), RNS2 (P10153), RNS3 (P12724), RNS4 (P34096), RNS5 (P03950), RNS6 (Q93091), RNS7 (Q9H1E1), RNS8 (Q8TDE3), RNS9 (P60153), RNS10 (Q5GAN6), RNS11 (Q8TAA1), RNS12 (Q5GAN4) and RNS13 (Q5GAN3). Sequence alignment is generated and labelled as in Figure 2A. Residues number 7, 39, 85 and 119 that involved in EphA4-binding are labeled in red. D. Comparison of the R39 of RNase1 (orange) and variants H39, P39, S39, T39 and D39 interact to E55 or V57 of EphA4 (green), respectively. The distance between two interactive residues is labelled.

