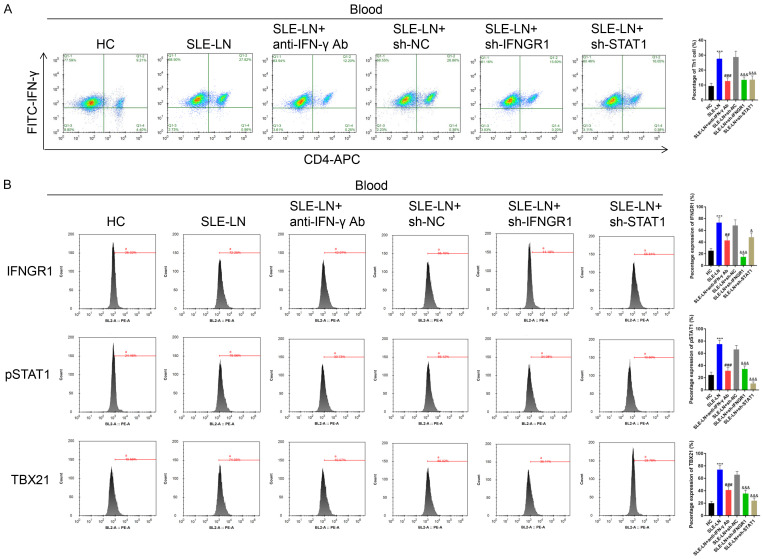
Figure 8.
Th1 cells in blood samples from SLE mouse models. A. Th1 cells in the indicated groups were analyzed by Flow cytometry. B. Expression of IFNGR1, pSTAT1, IFNGR2 and TBX21 determined by Flow cytometry. ***P<0.001 vs. HC group; ###P<0.001 vs. SLE-LN group; &&&P<0.001 vs. SLE-LN+sh-NC group. SLE: systemic lupus erythematosus; HC: healthy controls; LN: lupus nephritis; NC: negative control.

