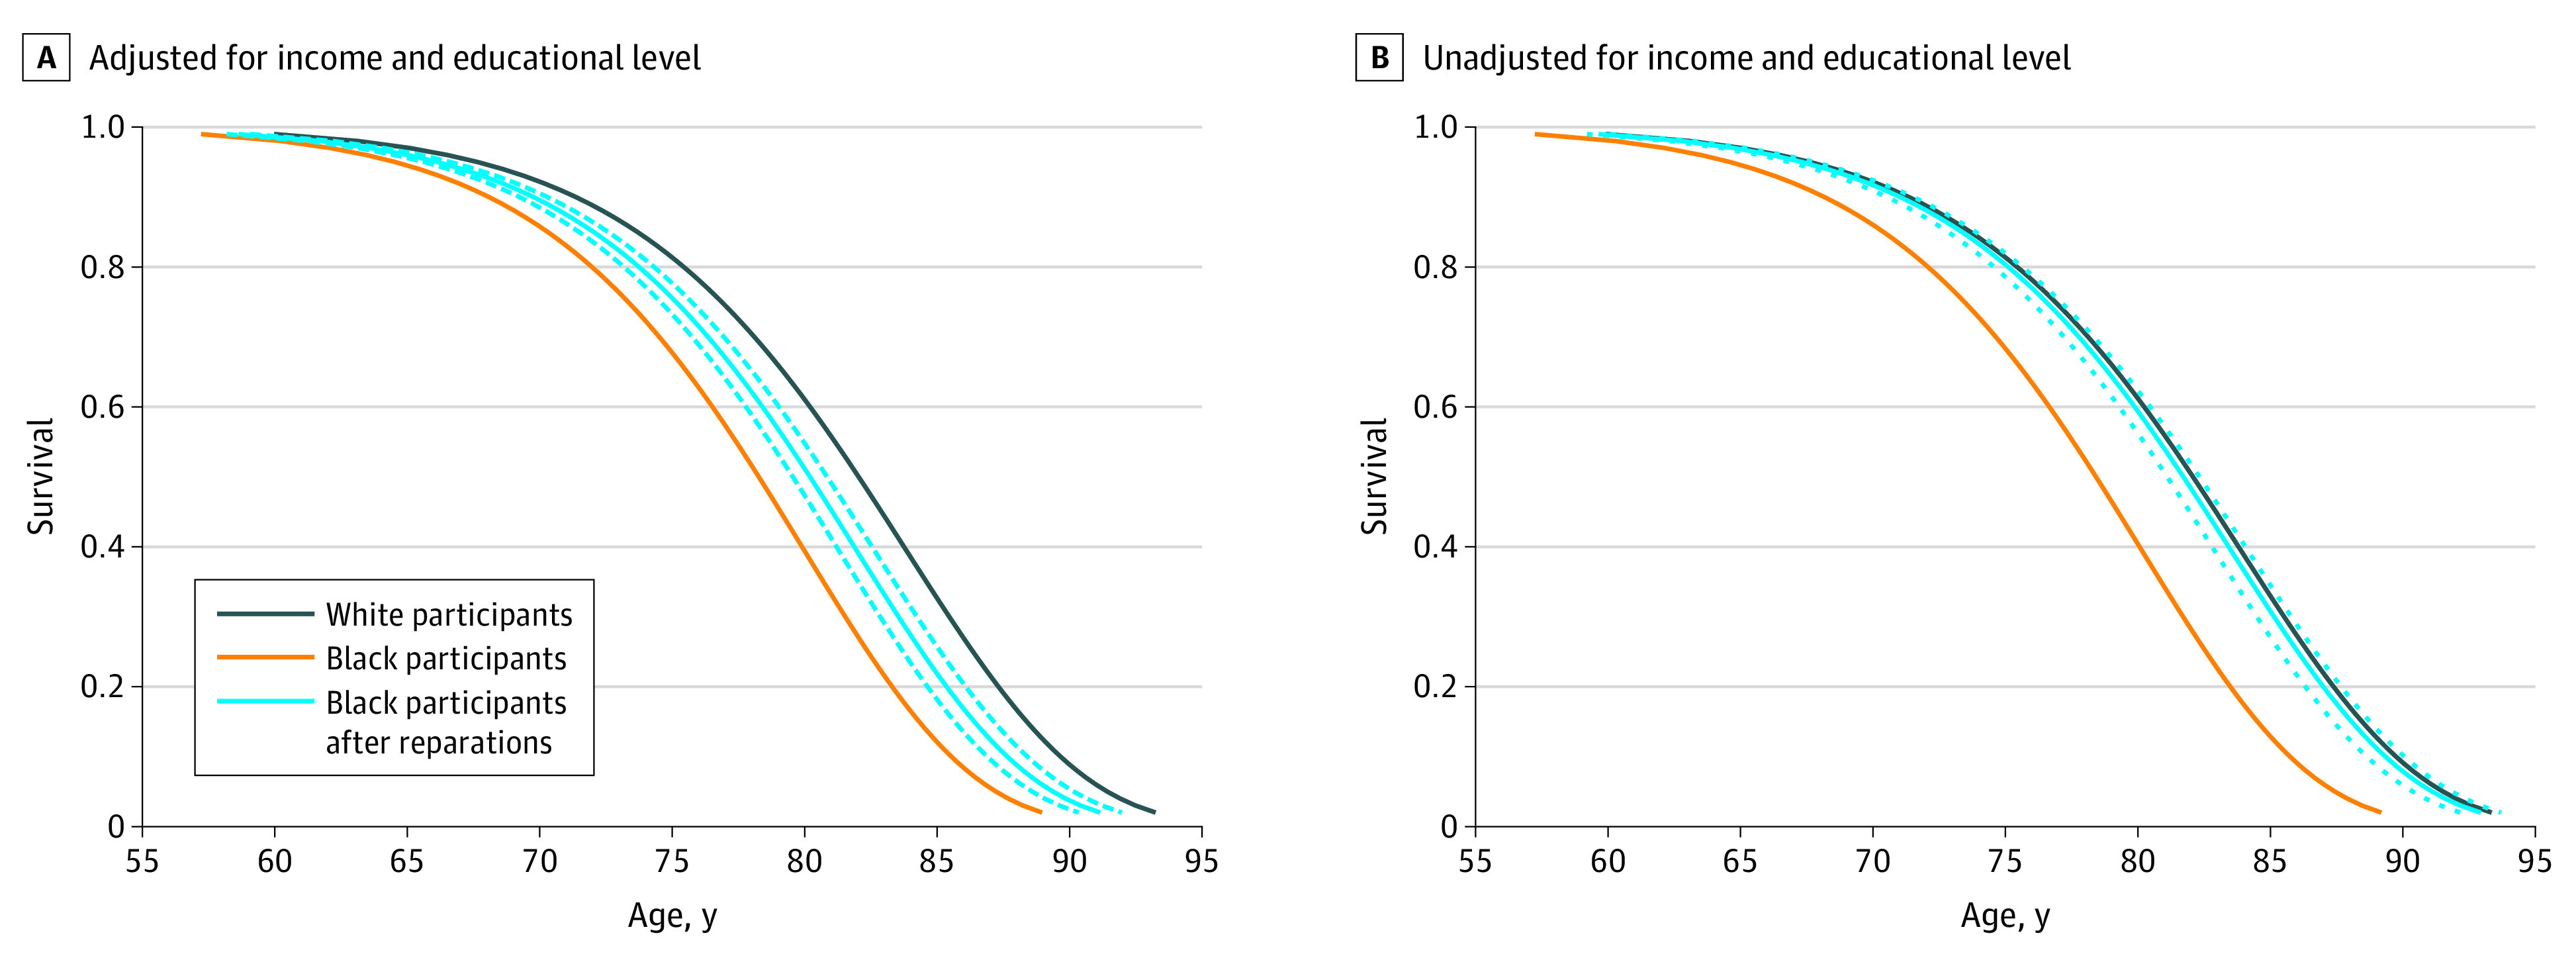
Figure. Survival of White and Black Participants and Projected Survival of Black Participants After Reparations Payments.

Data are from the Health and Retirement Study. Survival curves are drawn for an individual with the mean value of all covariates and using the Weibull survival models from Table 2. Dashed lines represent 95% CIs.
