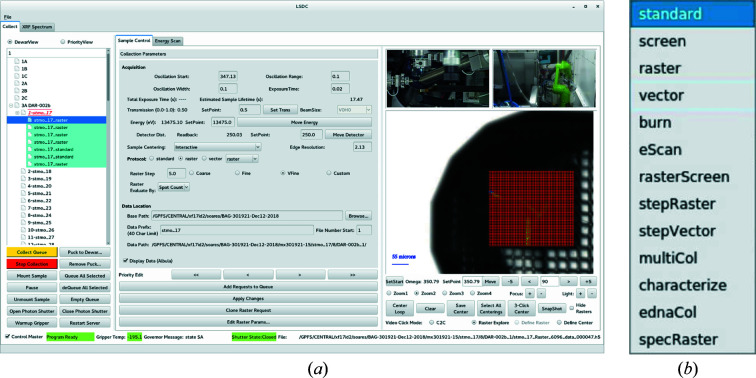
Figure 6.
(a) The samples/requests view is displayed in the left column, data acquisition parameters including access to all protocols are set in the center, and the sample video view including centering modes and interactive feedback of the raster heat map is displayed in the right column. Two of the pan zoom tilt (PZT) camera views are also displayed in the GUI so that users have a good overview of what is happening in real time at the beamline. (b) The drop-down menu of the currently available protocols.

