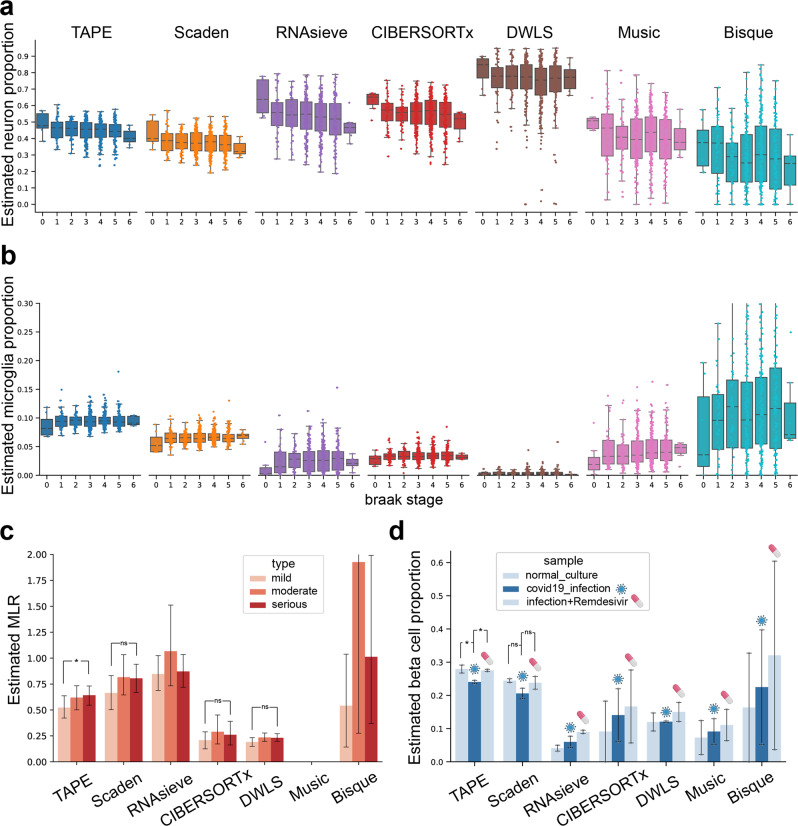
Fig. 3. Deconvolution benchmark on datasets with clinical information.
a Comparison of estimated neuron cell proportion on different Braak stages between different models on the ROSMAP dataset. Neuron content is expected to decrease along with the development of AD. b Microglia content estimated by different methods on Braak stage. The fraction is expected to increase from stage 0 to 5 followed by a decrease from stage 5 to 6. In a, b, sample size of each stage from 0 to 6 is 7, 43, 47, 150, 174, 104, and 7, respectively. The boxes represent IQR while the solid line represents the median. The whiskers extend to points that lie within 1.5 IQRs of the lower and upper quartile, and then observations that fall outside this range are displayed as points independently. c Estimated MLR value calculated from the estimated monocytes fraction divided by the sum of estimated proportions of CD4+ T cell, CD8+ T cell, and B cell. We expect MLR value increases from mild (n = 12) stage to moderate (n = 14) and serious (n = 12) stage. After one-sided Wilcoxon signed-rank test, we find that MLR increasement from mild to serious stage of TAPE has significance with p = 0.0461. d Estimated beta cell fractions of cultured islet in different conditions. The middle column represents samples infected with SARS-CoV-2, and the right one means samples treated with Remdesivir after infection. Sample size of each bar is 2. The model should predict the restoration of beta cell content after being treated with medication. One-sided t-test was used due to the small sample size. For TAPE’s prediction, the p value is 0.0475 and 0.0142 for normal versus infected and treated versus infected, respectively. In c, d, these data are presented as mean values ± standard error of the mean. p value with notation * means p < 0.05, with notation ns means no significance. Source data are provided as a Source Data file.

