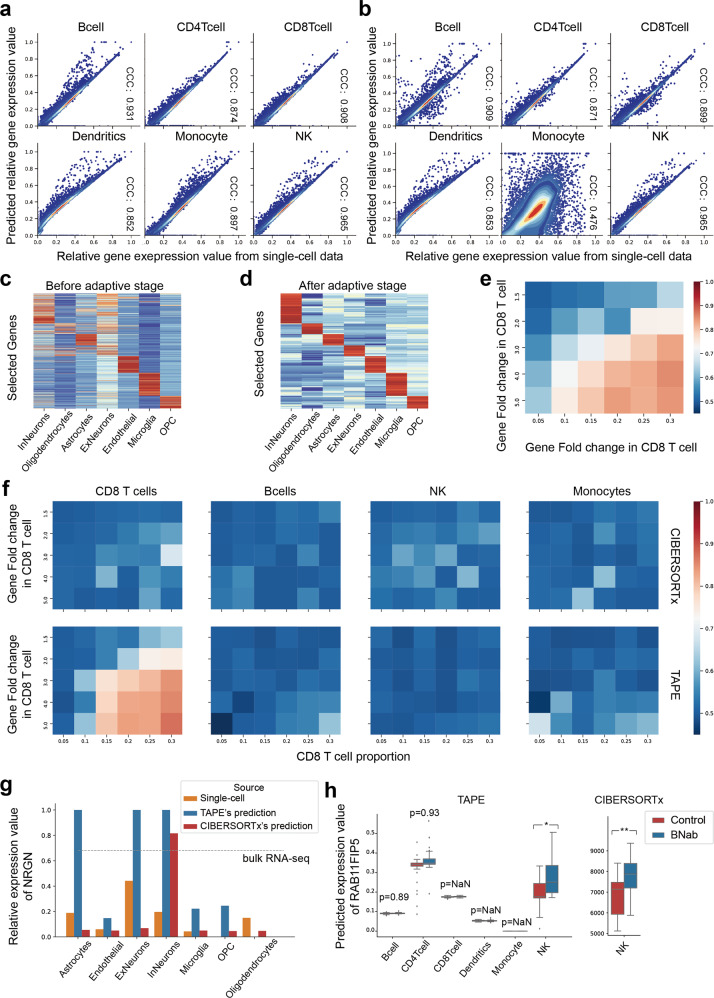
Fig. 4. Cell-type-specific gene expression analysis.
a Concordance between the predicted relative gene expression value in simulated bulk data and the relative gene expression value in single-cell data. The relative gene expression value is the original expression value after and MinMaxScaler() transformation. b Concordance between the predicted relative gene expression value in real bulk data and the relative gene expression value in single-cell data. c, d Estimated signature matrix after the adaptive stage in the “overall” mode. The gene expression is normalized with Z-Score. The genes are selected by the differential expression in different cell types after the adaptive stage. The differences between before and after the adaptive stage indicate that TAPE could not only make the signature matrix adapted to new data but also maintain concordance with the original one. e Differentially expressed genes detected from bulk RNA-seq data. The color indicates the AUROC value, red means better classification performance. Each row corresponds to different up-regulated foldchanges of randomly selected genes in CD8 T cells. Each column refers to CD8 T cell proportion in simulated bulk data. f Differentially expressed genes detected by CIBERSORTx and TAPE in different cell types. DEGs should only be detected from CD8 T cell. g The relative gene expression value of NRGN from different sources. The dashed line represents the total relative NRGN expression value in the AD patients' brain tissue. The missing column means the relative gene expression value of prediction or single-cell data is zero. h Boxplots of the estimated RAB11FIP5 gene expression values in different cell types by different methods. Both control group and BNab group have 46 samples in it. The estimated RAB11FIP5 values by CIBERSORTx in other cell types are NaN (not shown). p value is calculated from two-sided t-test. p value has been adjusted by the false discovery rate. p value with notation * means p < 0.05 (exact value for TAPE is 0.025), with notation ** means p < 0.01 (exact value for CIBERSORTx is 0.00041). The boxes represent IQR while the solid line represents the median. The whiskers extend to points that lie within 1.5 IQRs of the lower and upper quartile, and then observations that fall outside this range are displayed as points independently. Source data are provided as a Source Data file.

